
View and filter an amplicon coverage report
You can view an amplicon coverage report in Ion Reporter™ Software that shows which amplicons in an analysis do not have coverage. The report covers all bases to a user-defined coverage depth threshold. You can filter the list of amplicons that are shown in the report. The list is based on the threshold that you select and can adjust.
- In the Analyses tab, click Overview, then select row for the analysis of interest.
-
Click
 .
.
Alternatively, you can click the analysis of interest to open the Analysis Results table, then click .
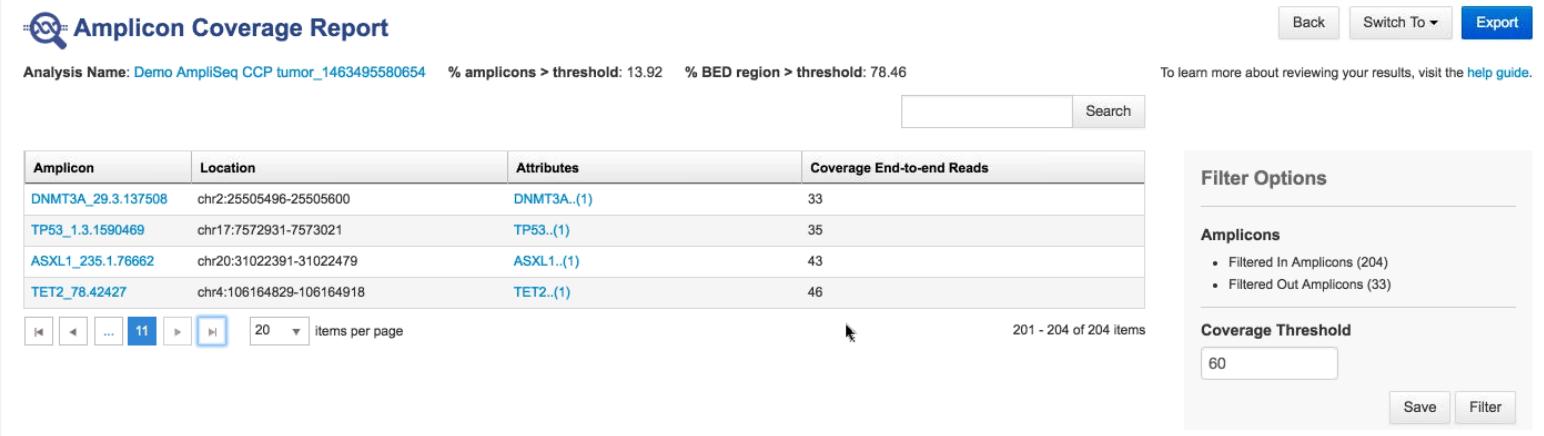
The Amplicon Coverage Report screen opens. The default value for the threshold is 0, so by default no amplicons are included in the list.
-
In the
Filter Options
section, enter a
Coverage Threshold
value, for example 60, then click
Filter. To
save this threshold as the default for this amplicon coverage report, click
Save.
The following metrics appear in the Amplicon Coverage Report screen.
Coverage Quality Control (QC) metric
(% amplicons > threshold)
Percentage of the total number of amplicons in the panel that have coverage at all bases at a level greater than the Coverage Threshold value.
(% BED region > threshold )
Percentage of the total bases that are defined in the panel regions BED file with coverage that is greater than the Coverage Threshold value .
If the filter option was previously saved, the % amplicons > threshold and % BED region > threshold values change to reflect the Coverage Threshold value.
-
Click Export to generate a tab-separated CSV file that contains amplicon metrics details such as chromosome location, and start and end positions on forward and reverse strands.
The downloaded file is named ampliconmetrics.csv.