Alpha-beta diversity results
The Metagenomics 16S analysis workflow in Ion Reporter™ Software includes alpha diversity calculations and beta diversity calculations.
Alpha diversity results describe the diversity in a single sample at the species, genus, and family levels. Beta diversity results describe the diversity between multiple samples at the species, genus, and family levels. For results interpretation guidance, see the QIIME online help at qiime.org.
Note: If you run only one sample, Ion Reporter™ Software returns only alpha diversity results. If you have two or more samples, you get beta diversity results. However, PCOA plots can be generated only for more than three samples, depending on the quality of data input.
Quantitative Insights Into Microbial Ecology (QIIME) algorithms determine what species, genus, or families are present.
- In the Analyses tab, click Overview,
-
In the Analyses screen, click the name of your metagenomics analysis. You can filter the list to display only metagenomics analyses.
An Analyses summary opens.
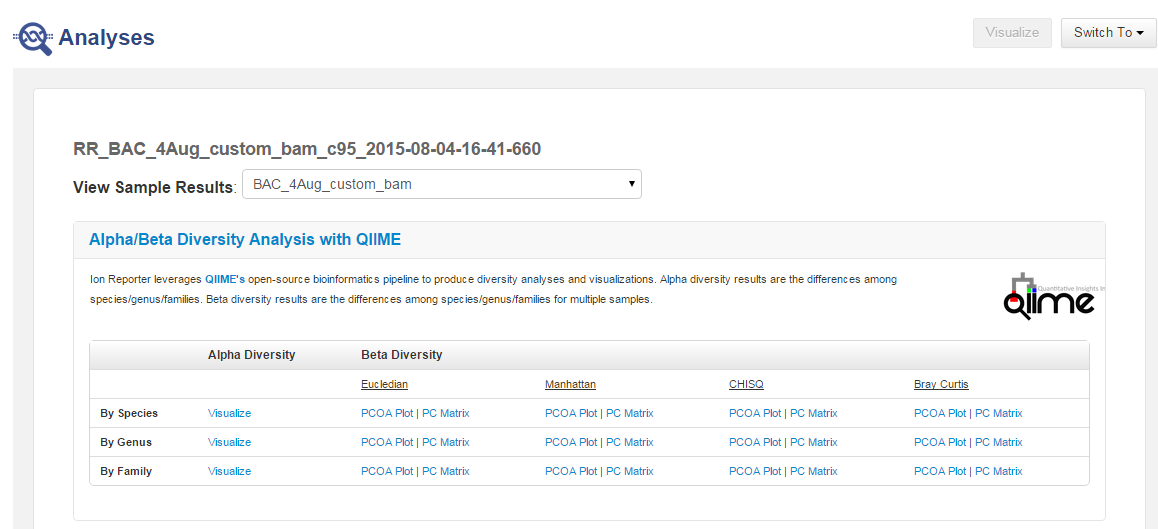
- Review your results by clicking the Visualize links in the Alpha Diversity column or the various plots and matrices links in the Beta Diversity column.
-
Scroll down to Summary and Results sections to see overall statistics.
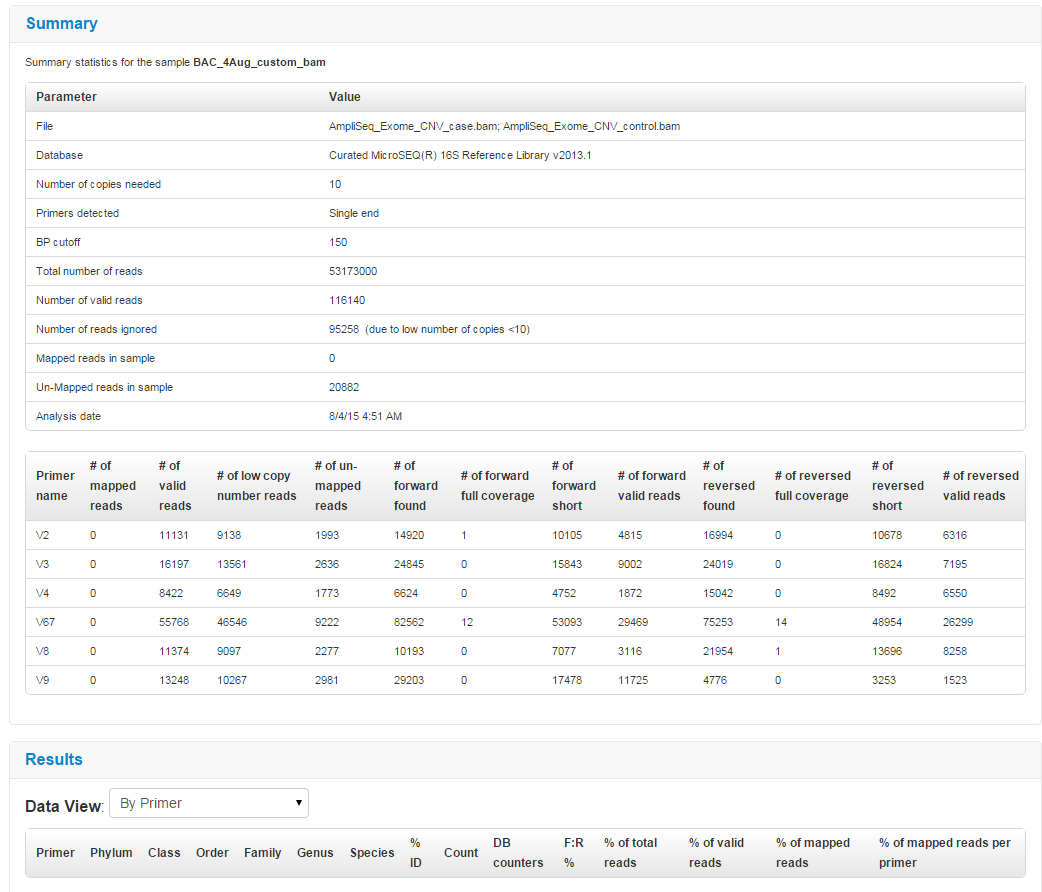
Alpha-beta diversity calculations are based on the information that is gathered from the consensus files that are generated by the Metagenomics 16S analysis workflow. Read counts per sample for species, genus, and family are collected. Operational taxonomic unit (OTU) tables are generated. These tables are used by QIIME to generate alpha-beta diversity results.
-
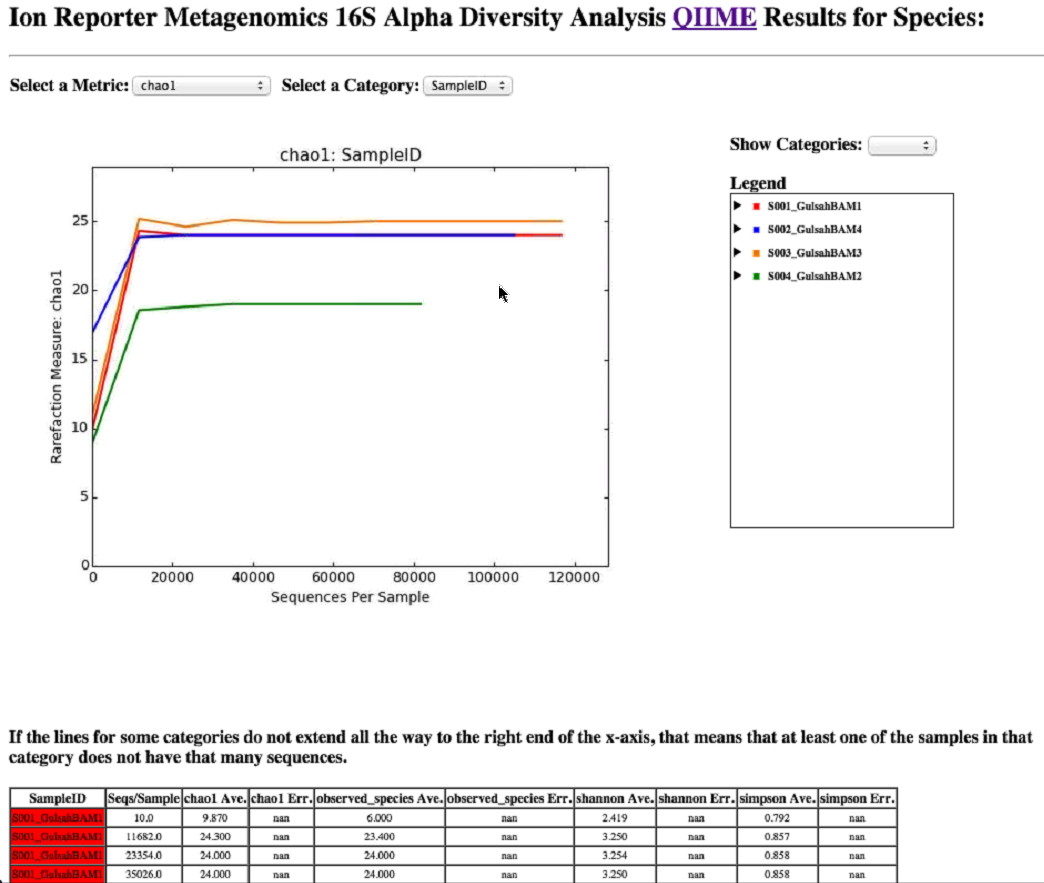
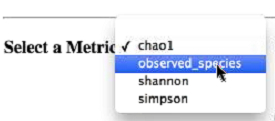
In the By Species row, in the Alpha Diversity column, click Visualize, then in the resulting screen, select your metrics.
- Repeat for By Genus and By Family links in the Alpha Diversity column to see the genus and families that are in the sample.
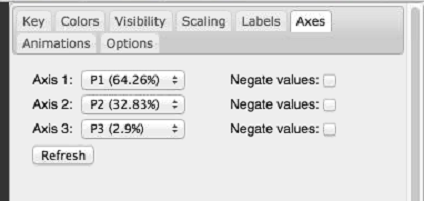
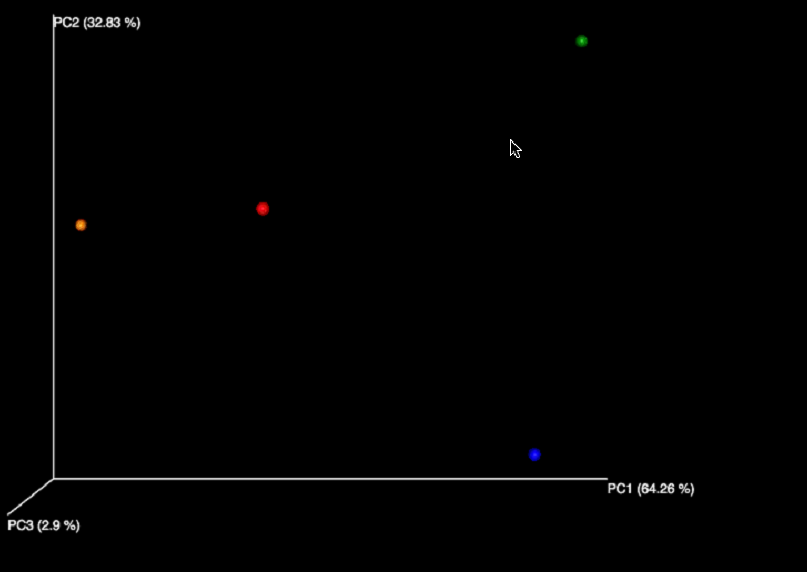
- In the By Species row, in the Beta Diversity column click the PCOA Plot/PC Matrix link.
-
In the resulting screen, you can view several plot types, including: Eucledian, Manhattan, Chi-Square and Bray Curtis PCOA Plots and PC Matrices.
-
Tools on the right can be used to produce an image.