View metagenomics analysis results
Sequences from different 16S databases may use different taxonomic hierarchies. For example, Greengenes may have de novo classified sequences labeled as Archaea>Crenarchaeota>Thaumarchaeota, where Thaumarchaeota is a class of Crenarchaeota. Records from other databases may treat both Thaumarchaeota and Crenarchaeota as phyla. Therefore, you may see differences in taxonomies when you compare 16S metagenomics analysis results from the two databases used in Ion Reporter™ Software to other, external databases.
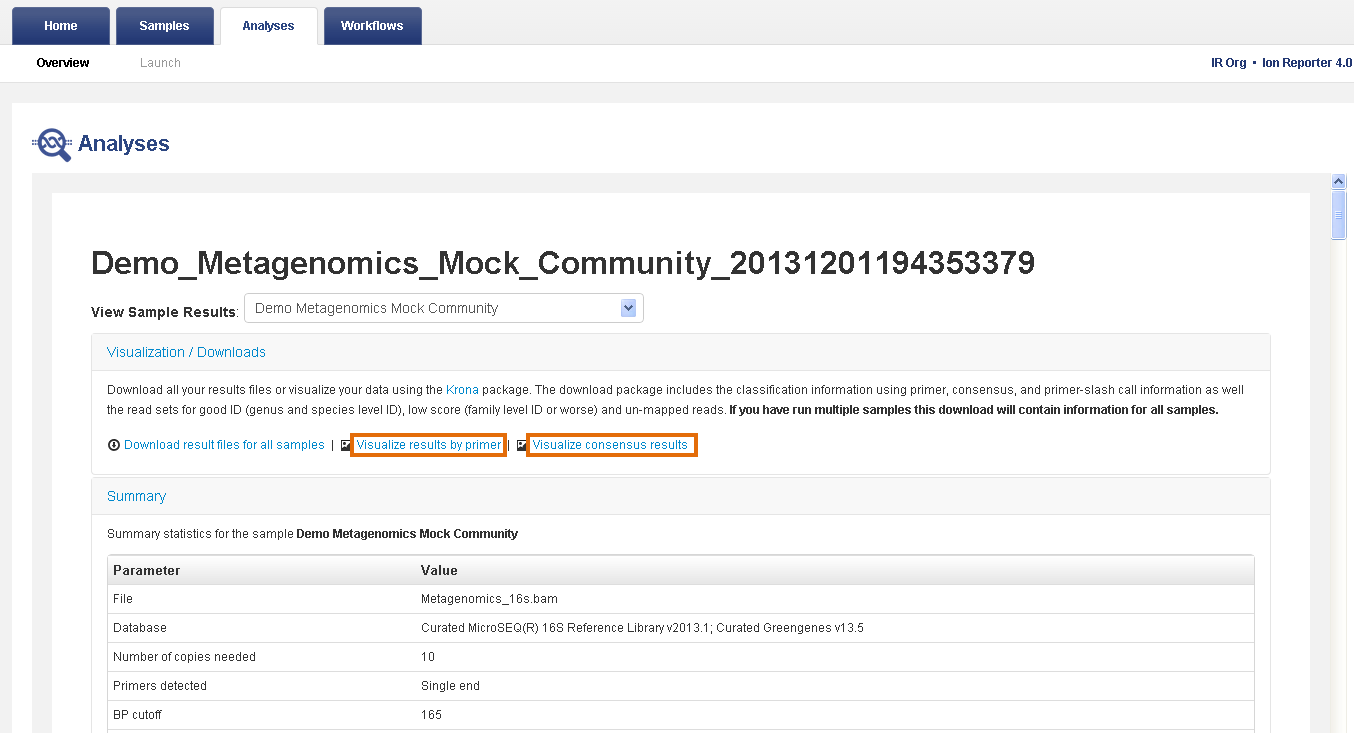
- In the Analyses tab, click Overview.
- In the Analyses table, click the name of your metagenomics analysis to view the analysis results.
- Review the Visualization / Downloads, Summary, or Results sections.
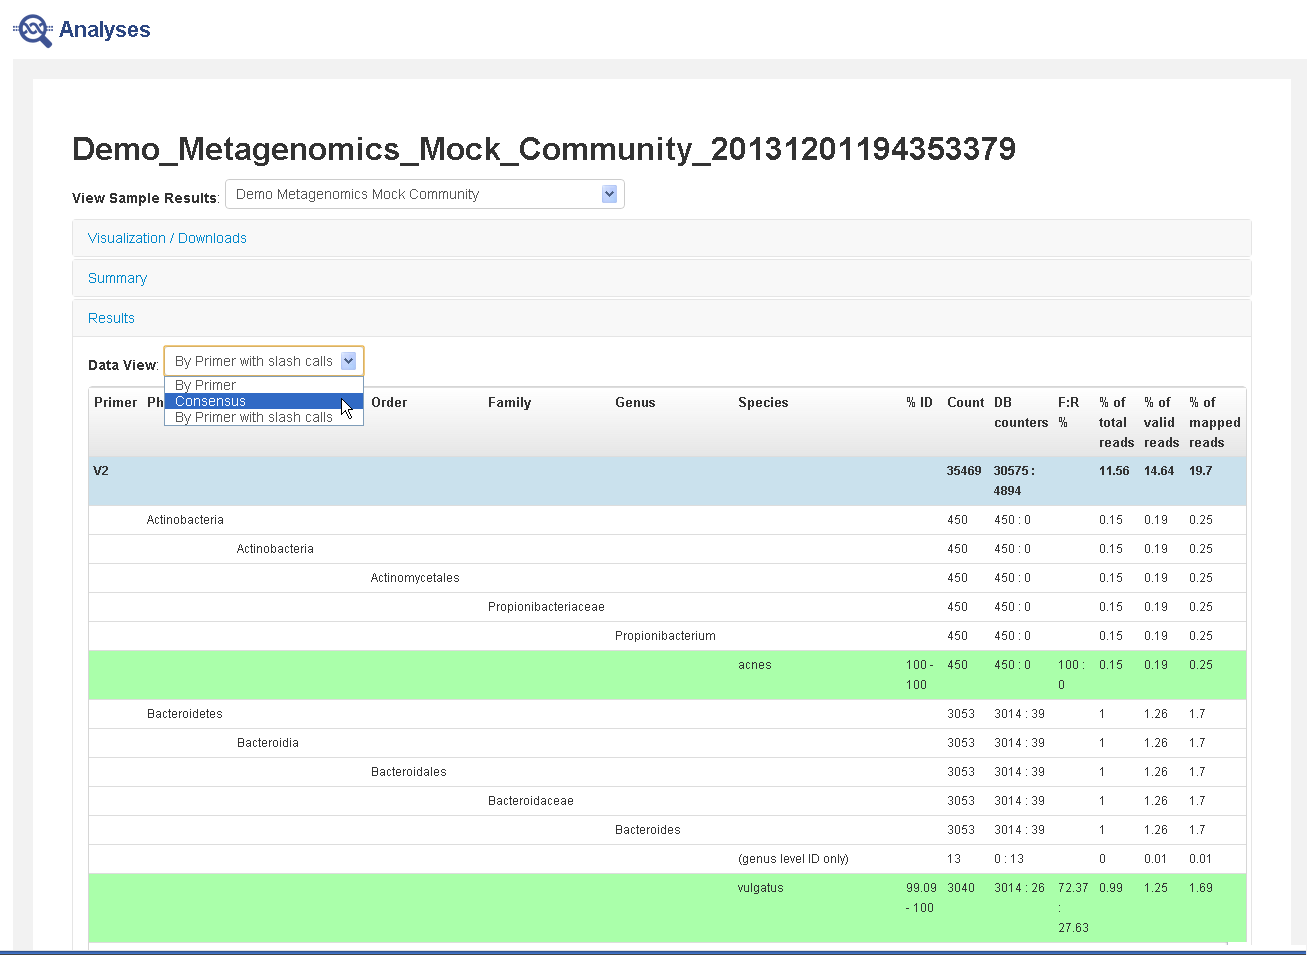
Note: In the Analyses Results table, Total Mapped Reads in a sample differs from the sum of the bottom species-level counts. The reason is that the Total Mapped Reads are filtered by genus cutoff, species cutoff, and minimum alignment coverage. The topmost number in the "count" column differs from the sum of the taxonomy levels below it, because the reads that did not satisfy the filters are also included in the total mapped reads.
Visualization/Downloads section—Contains links to view interactive taxonomy charts and download results files. For more information, see View interactive taxonomy charts for metagenomics analyses and Reference output files for Metagenomics.
Summary section—Contains analysis and parameter information and read metrics by primer.
Results section—Contains either consensus data (combined from all primers) or data broken out by primer. Reads that can be identified down to the species level are marked in green.
- In the Results section, click Data View to display either consensus data (combined from all primers) or data broken out by primer, with or without slash calls.
- In the Visualization/Downloads section, click one of the visualization links to view your results with interactive taxonomy views.