
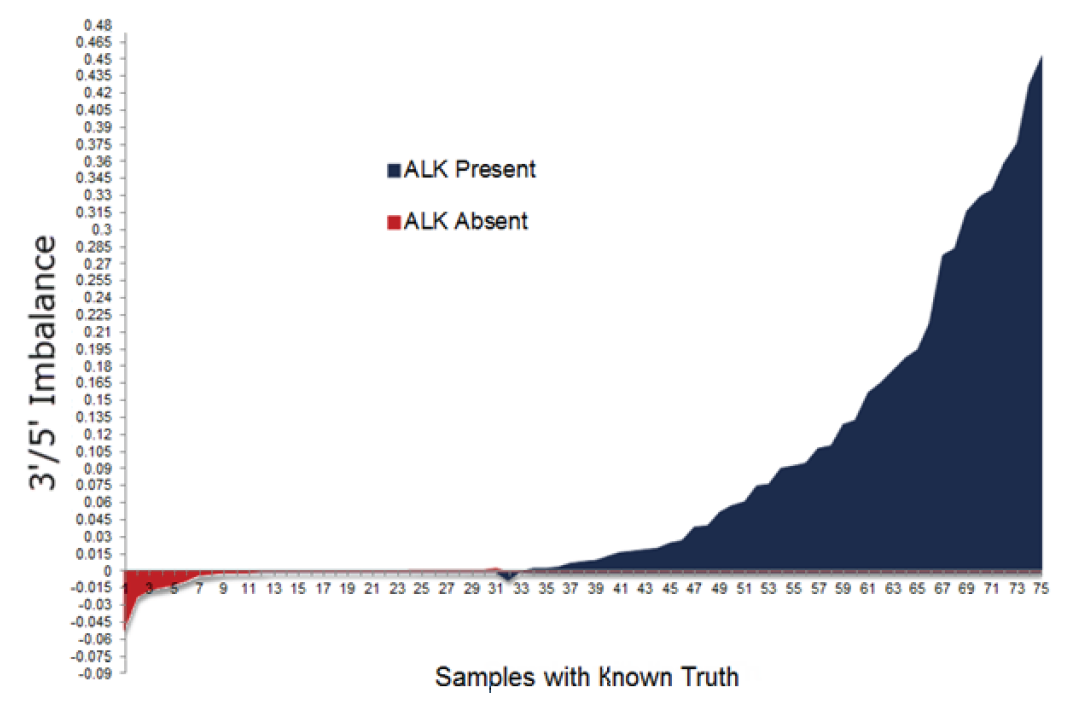
Example plot for ALK driver gene
This example plot for the ALK driver gene shows the correlation between low imbalance values and samples that do not contain a fusion (in red). Samples that contain a fusion (in blue) all contain higher imbalance values. For more information on novel fusion detection in Ion Reporter™ Software, see Novel fusion detection using expression imbalance.
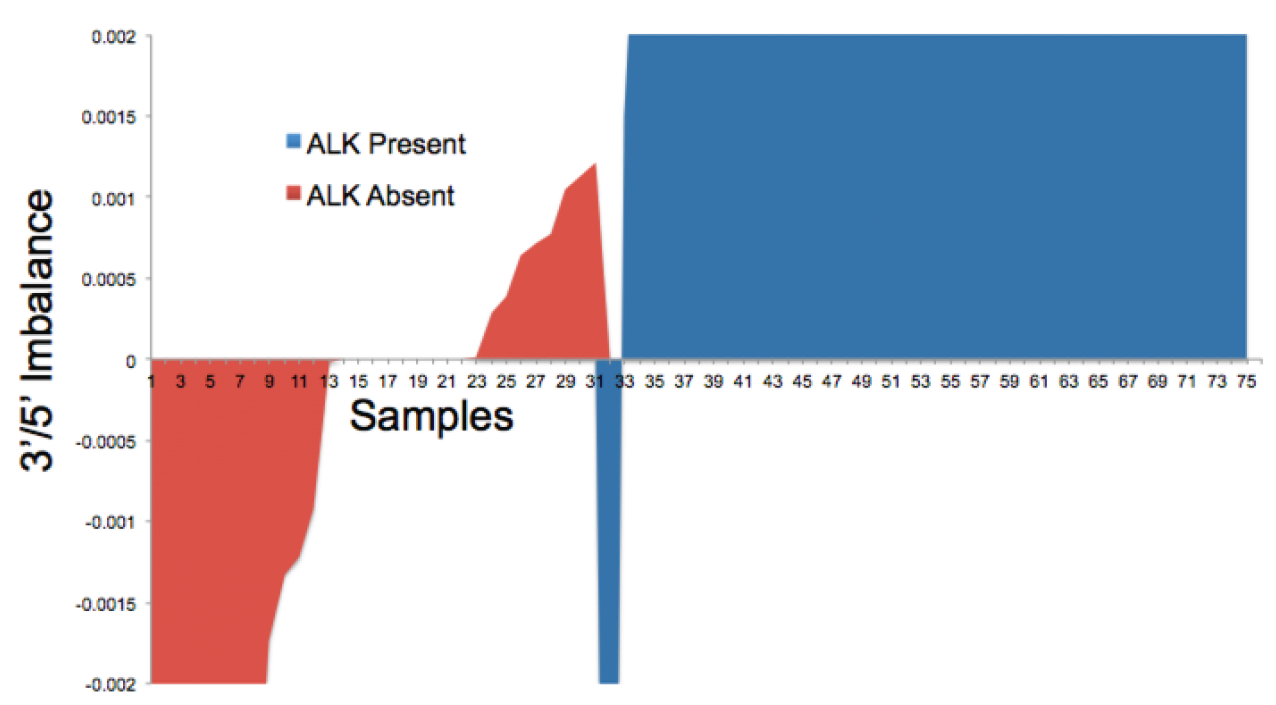
Zoomed in view:
-
A 3'/5' Imbalance value of 0.025 or greater indicates the likely presence of an ALK fusion.
-
Below 0.001, there is no evidence that an ALK fusion is present.
-
The range of 3'/5' Imbalance values between 0.001 and 0.025 is an area of uncertainty where there is some evidence that a fusion may be present. The higher the imbalance values, the more evidence there is that a fusion is present.