You can create a report that includes visualization images and data. When you open a visualization, you can generate the report with an existing report template, or from a new report template that you create in the Analysis Visualization screen.
On the Analyses tab, click Overview, then select one or more analyses that you want to visualize in Ion Reporter™ Genomic Viewer.
Click Visualize.
The visualization of the data are viewable in the IRGV & Generate Report tab of the Analysis Visualization screen. For example, a visualization can include a copy number histogram for each analysis, ploidy maps for selected chromosomes or chromosome regions, and karyograms that show copy number gains and losses.
Generate Report for the visualization
For six or more analyses results, the whole genome Karyo View cannot show Gain and Loss data segments.
Click Generate Report.
In the Select Visualization Report Template dialog box, select an existing report template in the drop-down menu or click Create New Report Template, then click OK.
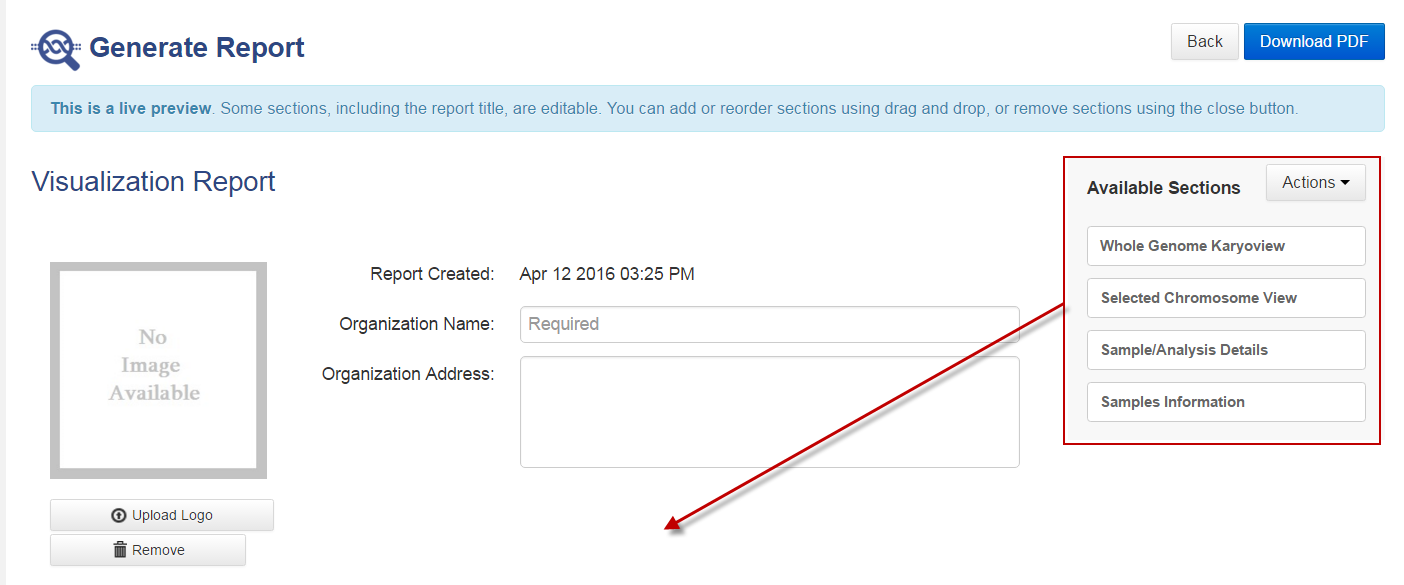
A preview of the report is shown. You can customize the report in the Configuration step.
Drag the title of the graphics and data that you want to include in the report from the Available Sections into the Visualization Report preview.
Enter an organization name for the visualization report. Enter any other relevant information.
In the Sign-Off section, enter the name and title for a handwritten signature, then click Add. Repeat this step to add the information for all additional required signatures, until all designated signers are added.
In the Footer Section, you can remove the Thermo Fisher Scientific logo from the report footer and add a custom logo. Acceptable formats are PNG, GIF, and JPG.
Click Remove to remove the Thermo Fisher Scientific logo from the report footer.
Click Upload Logo, then click Select File to browse to a custom logo file.
Select the file, then click Open to include the logo in the report footer.
When you are satisfied with the design of the visualization report, click Next.
A preview of the PDF report opens. Click Configuration to go back to the previous screen to change the report sections before publishing.
Click (Actions) > Download PDF to download the published report.
The report is downloaded to the location used for downloads from the browser. This location depends on the browser settings.
Note: When you generate a visualization report, the analysis is not locked.

 Download PDF to download the published report.