Compare results of single or multiple analyses
You can review results for single analyses, or compare the results of multiple analyses in the Analysis Visualization screen. Multianalysis visualization supports the following views, depending on analysis workflow type.
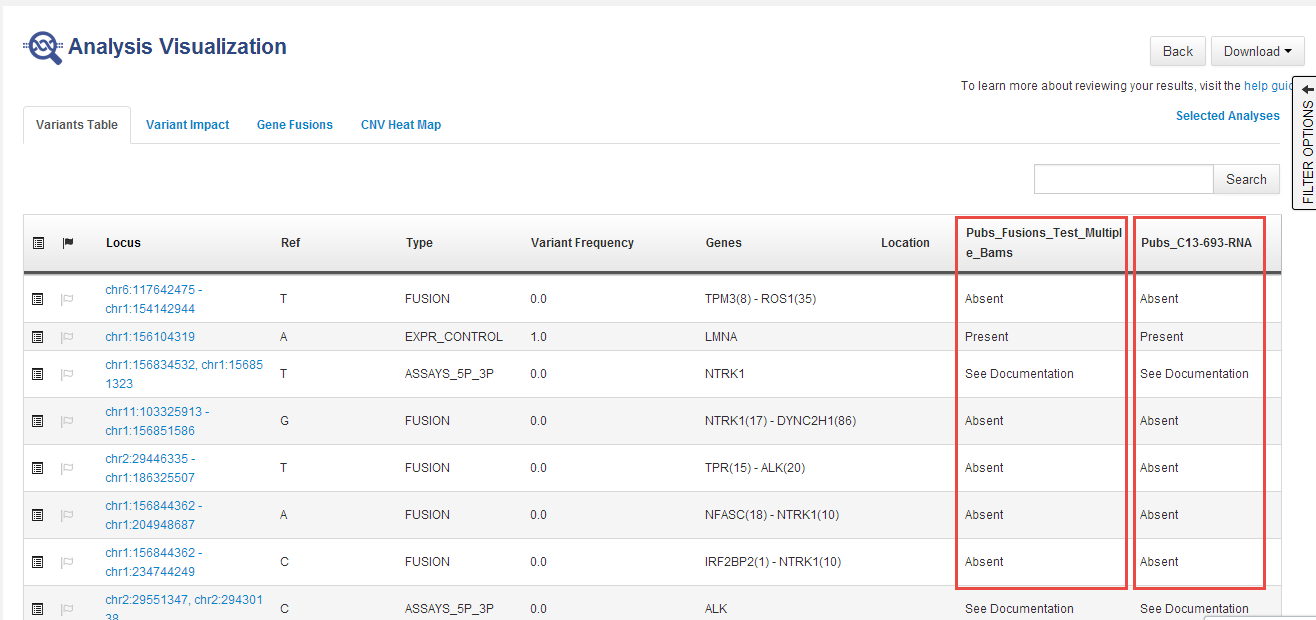
- In the Variants Table tab, the table view shows side-by-side columns to compare variant calls in different analyses:
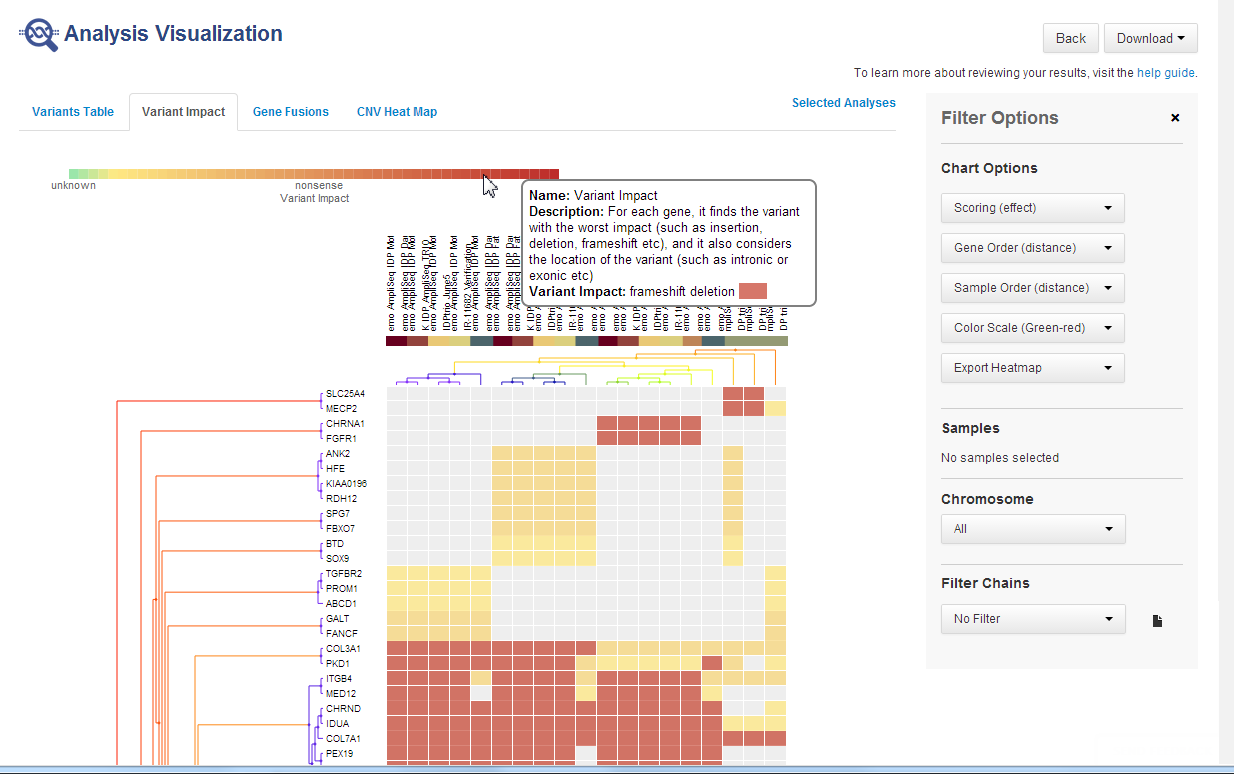
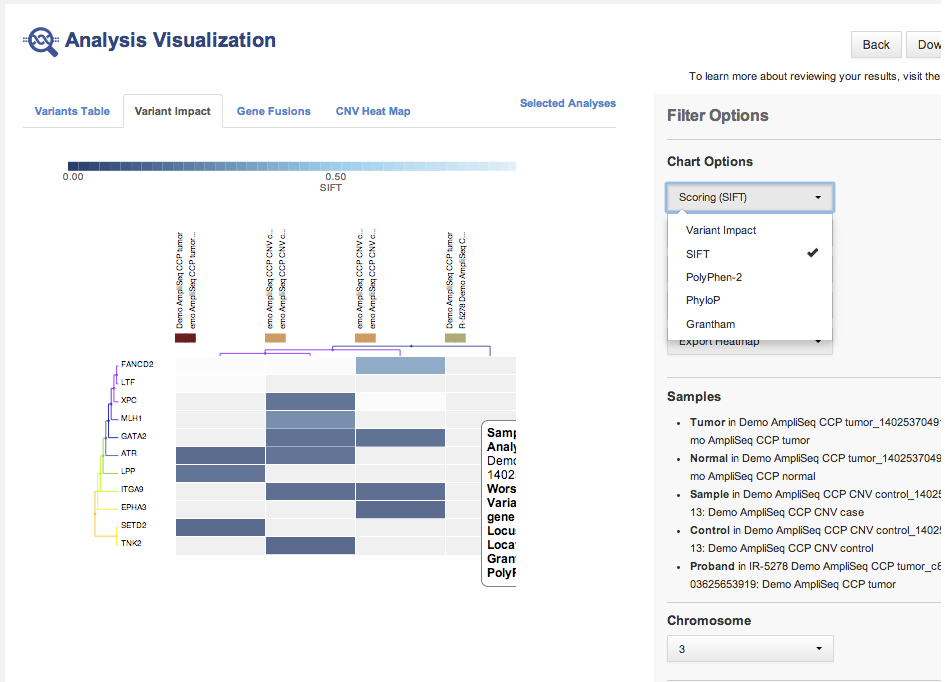
- In the Variant Impact tab, the variant impact heat map that displays is based on the predicted variant impact:
The following is a variant impact heat map that is based on the predicted variant impact.
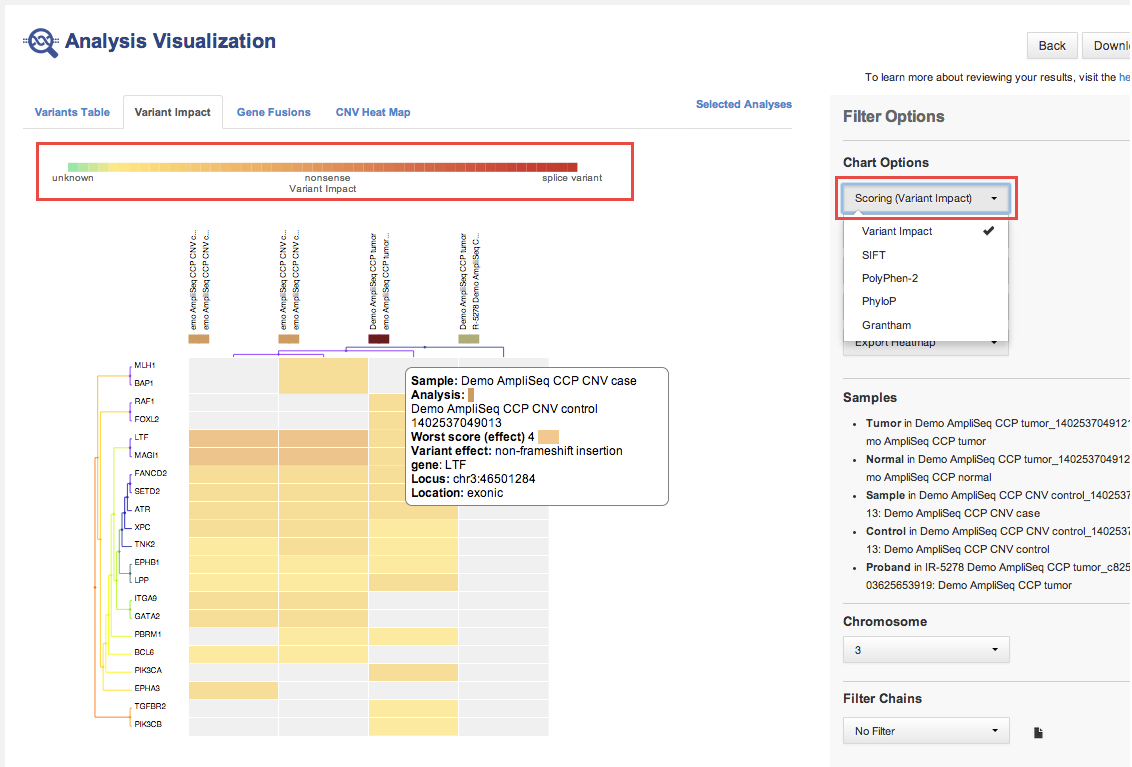
The following is a variant impact heat map that is based on other scoring.
The following is a gene fusions heat map.
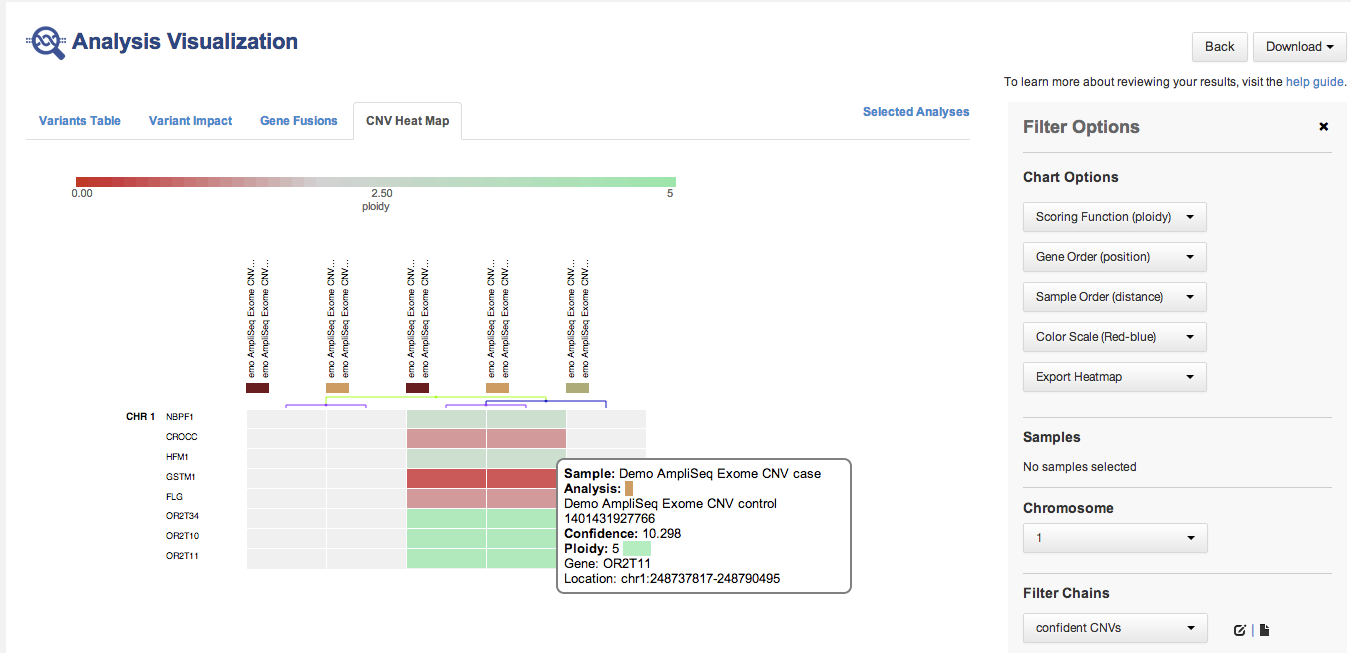
The following is a CNV heat map.
- RNA Exon Variants:


In most cases, you will compare similar analyses. However, Ion Reporter™ Software does not restrict comparisons to only similar analyses.
You can compare one trio or one paired analysis without selecting multiple analyses. Each trio or paired analysis contains more than one set of variants.
Hover over the legend of a heat map:
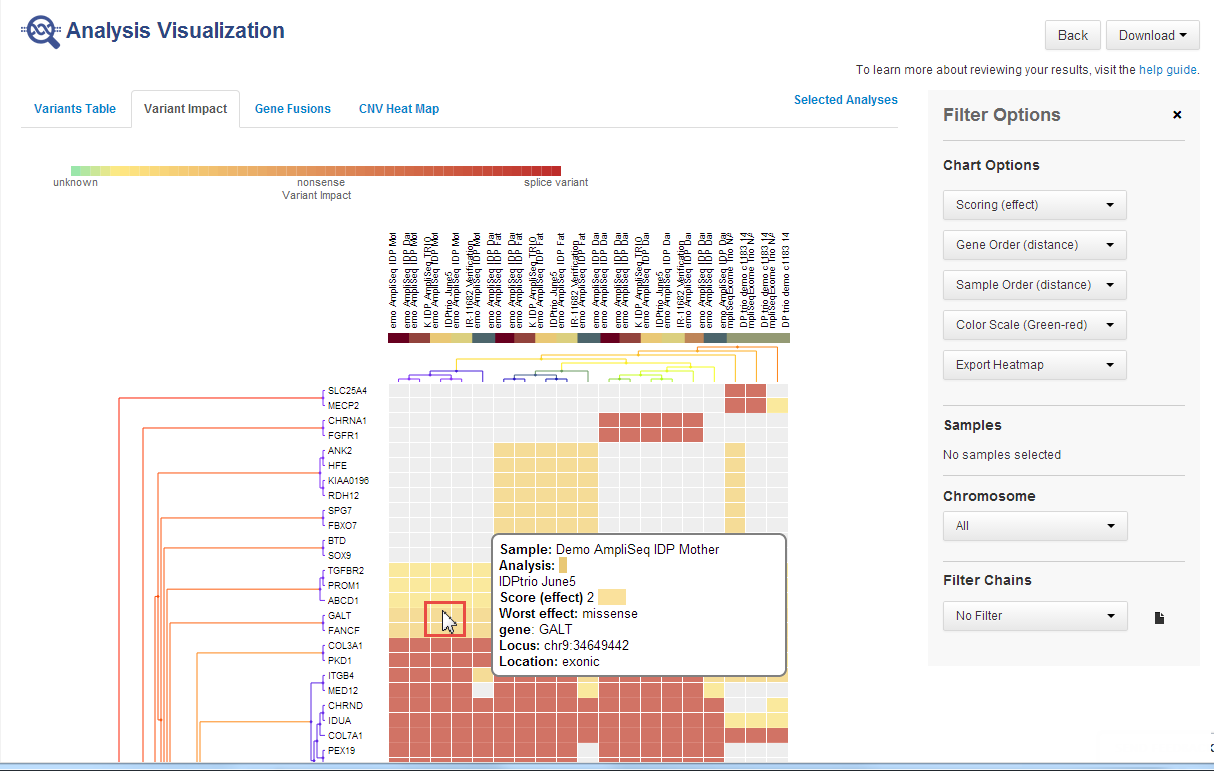
Hover over the legend of a cell to see more information: