
View interactive taxonomy charts for metagenomics analyses
You can use interactive taxonomy views to browse through metagenomics data.
Note: The Snapshot button does not operate on the visualization screen for the Metagenomics 16S analysis results in some browsers. You need to instead create a PDF of the visualization.
-
In the Analyses tab, click Overview.
-
In the Analyses screen, click the name of your metagenomics analysis. You can filter the list to display only metagenomics analyses.
-
In the results screen for the selected analysis, in the Visualization/Downloads section, click Visualize results by primer or Visualize consensus results to open an interactive taxonomy view.
-
Click Download results files for all samples to download all results files.
This table describes ways to use the interactive taxonomy views. For more information, see the documentation at this github site.
|
Task |
Your action |
|---|---|
|
Open the analysis data in an interactive taxonomy view |
Click the Visualize results by primer link. 
|
|
Open interactive taxonomy views on the consensus data |
Click the Visualize consensus results link. 
|
|
Download results files for all samples |
Click the Download results files for all samples link to download all results files for the metagenomics analysis.
|
|
Display percentages for one section of the chart |
Click that section of the chart. The percentages for that section are displayed in the top right of the page. 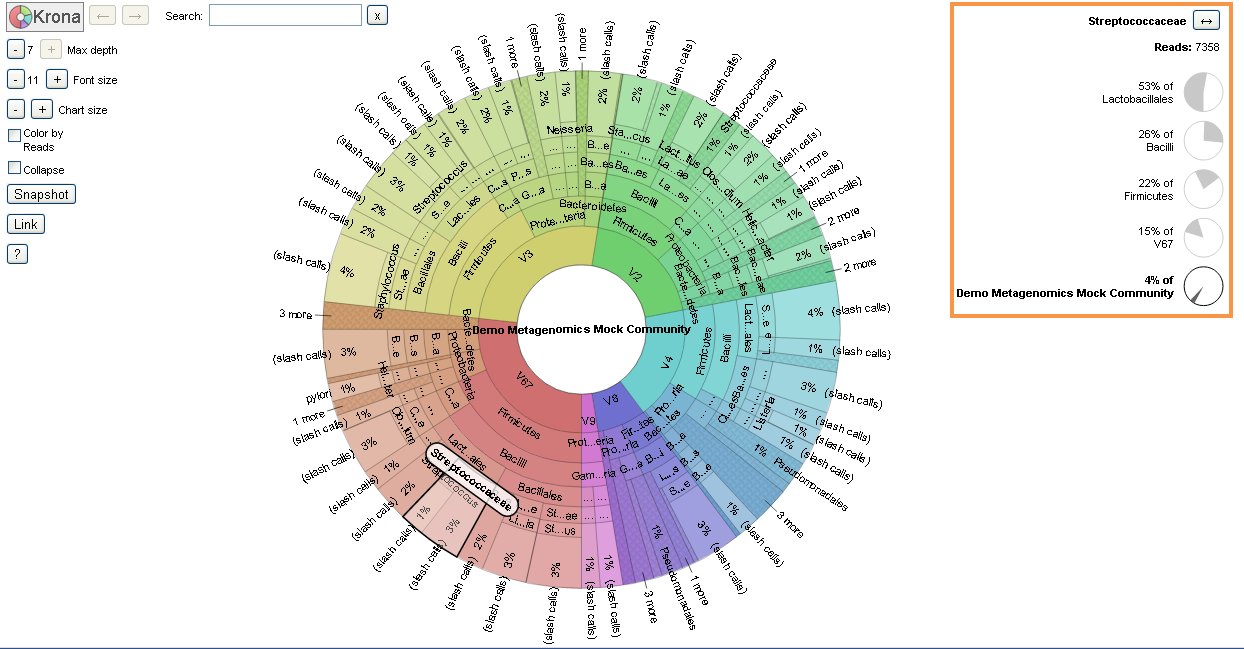
|
|
Make that section the new focus of the chart |
Click the expand box in the top right of the screen. 
|
|
Return to the previous chart focus |
Click the back arrow 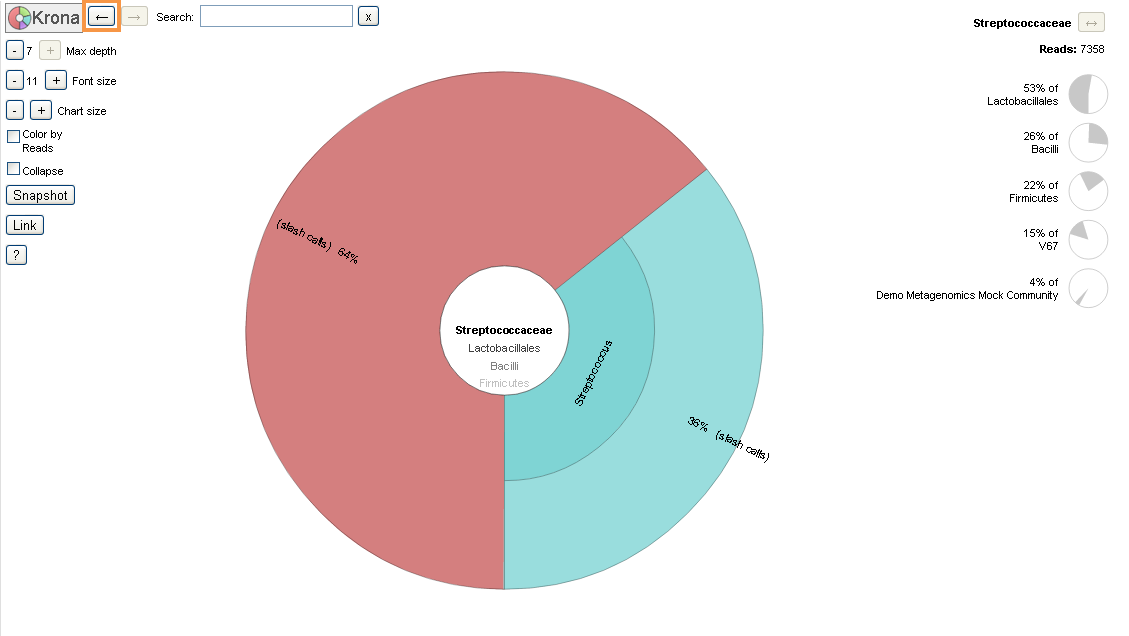
|
|
Change the number of circles shown in the chart |
Click the minus or plus icons 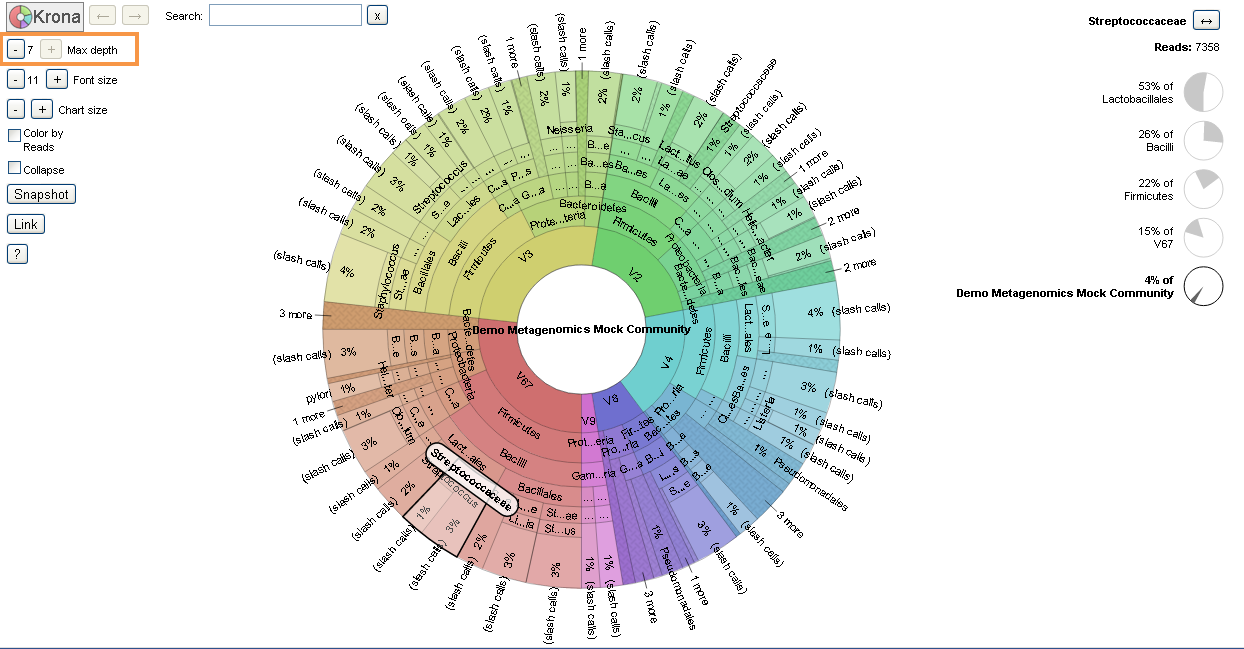
|
|
Change the font size |
Click the minus or plus icons 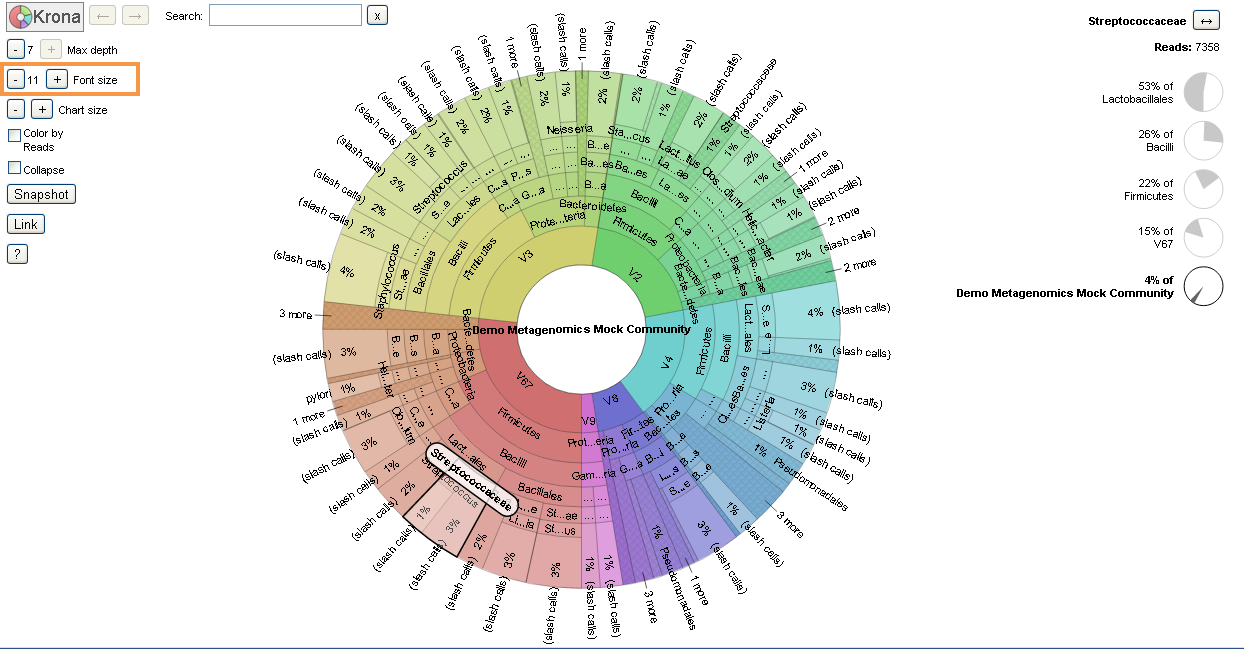
|
|
Change the size of the chart |
Click the minus or plus icons 
|
|
Show read depth by color |
Select the Color by Reads checkbox. A color legend appears in the bottom left. (This example shows a consensus chart.) 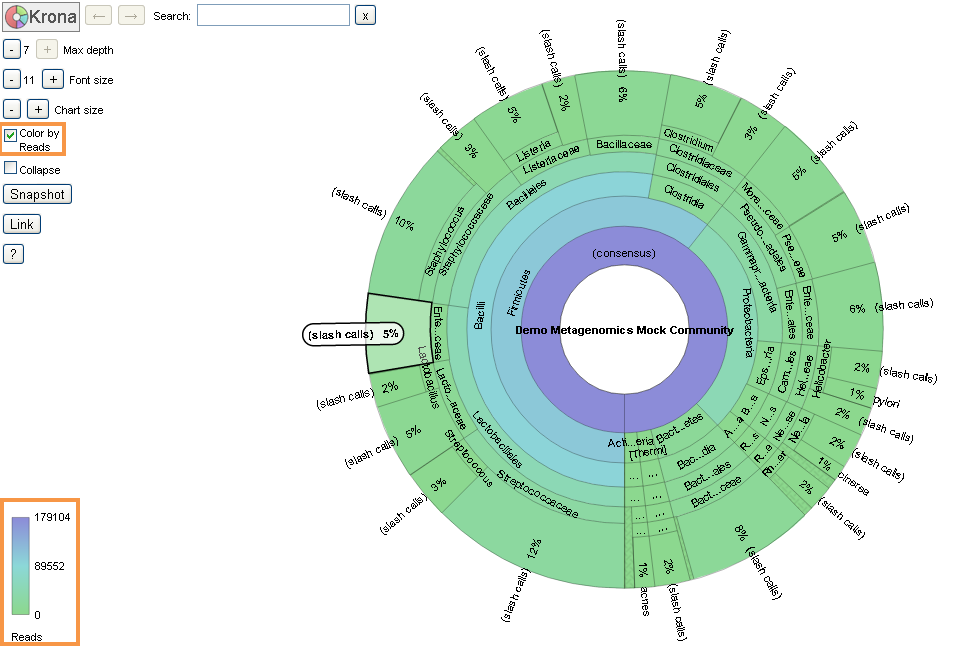
|
|
Simplify wedges |
Select the Collapse checkbox. This selection combines redundant wedges (that include only another wedge). 
|
|
Create an image of the pie chart |
Click Snapshot. 
Clicking this button creates a SVG (Scalable Vector Graphics) format image file. See the documentation at this github site for more information about browser support. (For example, in Chrome™ browser, an SVG file is not created directly. You need to save the screen as a PDF file.) |
|
Create a sharable link to the chart |
Click Link. 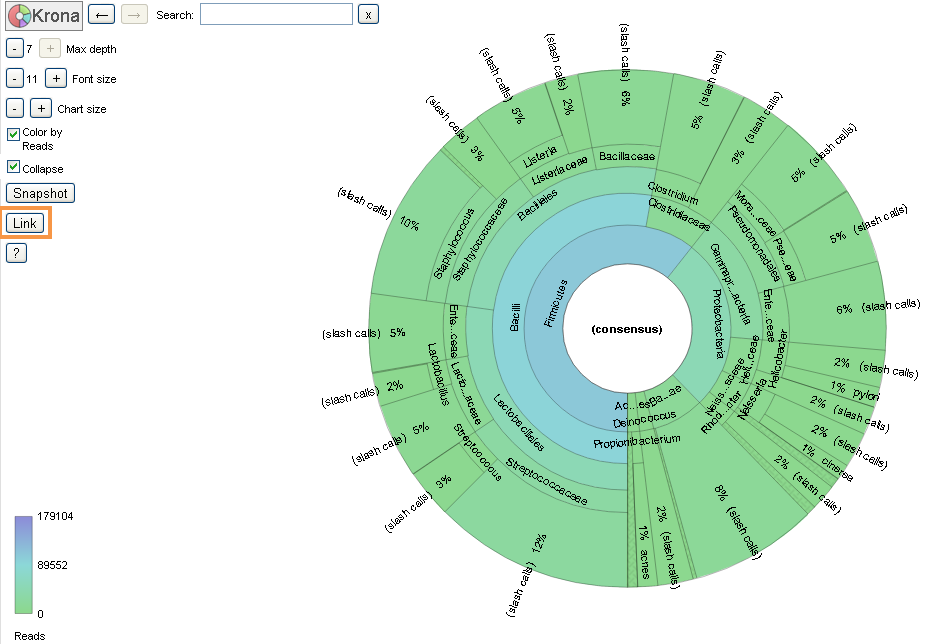
|
|
Open Krona™ documentation |
Click the question mark to open the documentation in a new tab. 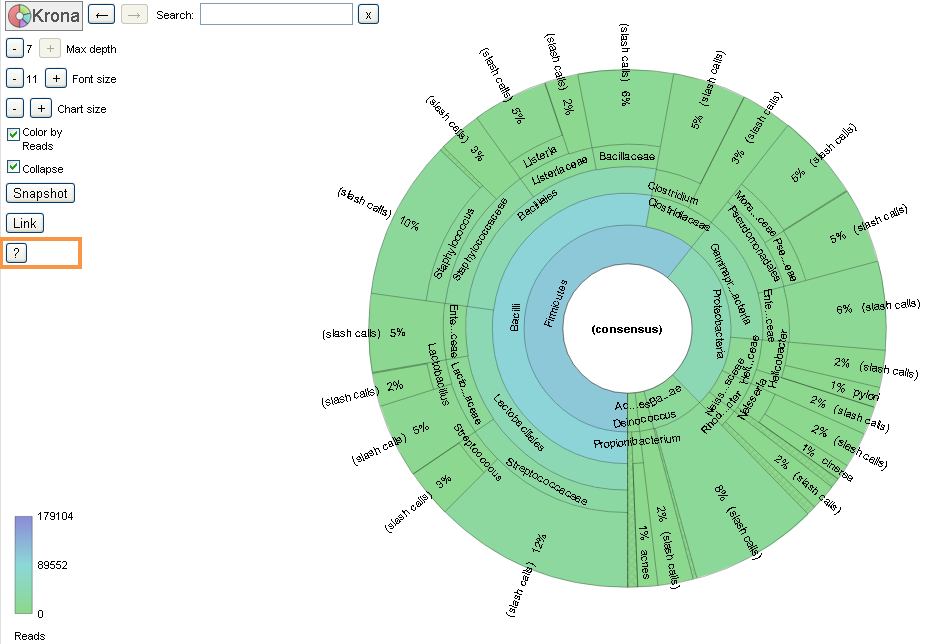
|
 at the top left of the screen. You can complete only one go-back action at a time.
  near the