Multiple analyses and multiple analysis types in IRGV
You can view multiple analyses in a single Ion Reporter™ Genomic Viewer (IRGV) visualization. The analyses can be different types of analyses. The following image is a whole genome view of an aneuploidy, Oncomine™, and cancer hotspot analyses. Different types of analyses look different in the whole genome view and include different information in the Summary table.
Note: The maximum number of analyses that you can open in a single visualization depends on the size of the analyses results data.

The first analysis on the whole genome view graph is an aneuploidy analysis. The graph displays CNV calls. It also displays MAPD value, productive read count of the sample, and the confidence filter used in the default filter chain. Blue and red bars in the whole genome view represent CNV calls. Blue bars represent calls above the expected normal ploidy value (Copy Number Gains/Duplications/Insertions) for that chromosome (chr14 and 15 in this aneuploidy example). The Red bars represent calls below the expected ploidy value for the chromosome (Copy Number Losses/Deletions, chr 13 in this aneuploidy example).
The second whole genome view graph is an Oncomine analysis where somatic CNV calls have been made. Instead of using a confidence filter, this data uses 5% and 95% Confidence intervals that are not shown in this view. The green bars represent a density plot of SNPs, INDELs, and other calls. Click on any green density plot and the software zooms and displays the area in detail.
The various types of analyses also produce differing summary tables.
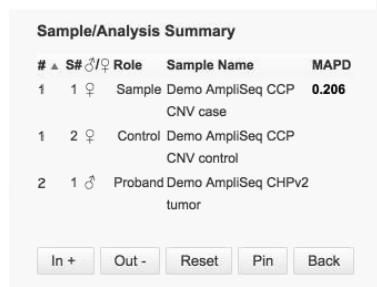
This summary table is from a CNV analysis:
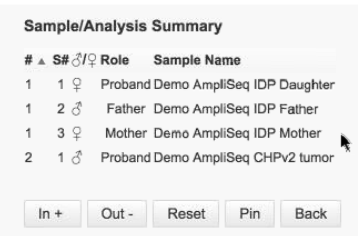
This summary table is from a Trio analysis:
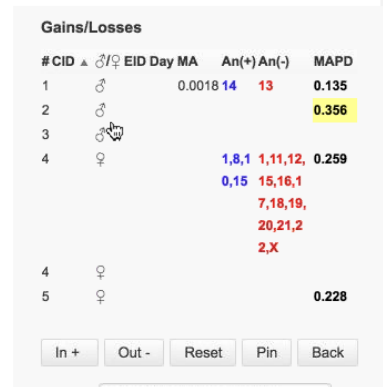
This summary table is from an aneuploidy analysis:
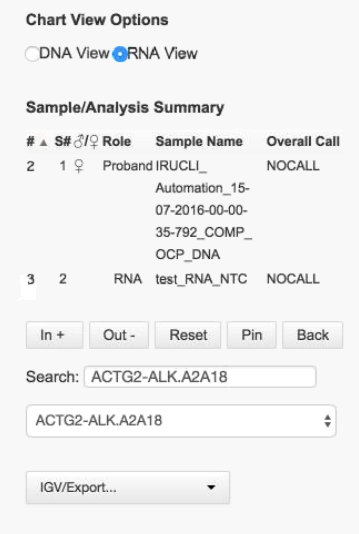
This summary table is from the RNA View option in a DNA analysis: