View analysis results for a single sample
Use this procedure to view and manage the extended analysis results of a single sample.
Note: Analyses that are performed as described in this procedure generate a variants table that does not have optimized TagSeq specific filters applied. These filters are applied only when you generate results analysis as described in Visualize identified variants in an Oncomine analysis from a TagSeq analysis workflow.
- Click the Analyses tab, then click Overview.
- In the Analyses screen you can:
To
Action
Select an analysis
Enable the checkbox.
Open an Analysis Results screen.
Click the hyperlink (in the Analysis column).
View details
Click anywhere in the analysis' row, except on the hyperlink.
Sort
Click column headings to sort the analyses based on the column contents.

Select analysis
Open Analysis Results screen
View details
Sort a column
- To view and manage the extended Oncomine™ Cell-Free Research Assay results, use the available filters to limit the list of analyses (for example, select your analysis workflow from the Workflow list), then click the hyperlink in the Analysis column.

- In the Analysis Results screen, sort or filter the data using the Oncomine™-specific annotations. See the software help menu for more options.
- Review the results in the Median Read Cov, Median Mol Cov, and LOD % columns.

Column
Description
Median Read Coverage
Reports median coverage across targets. Median Molecular Coverage reports median number of individual interrogated DNA molecules across targets.
Median Molecular Coverage
Directly influences the limit of detection in a sample run. We always require two independent molecular families to identify a variant for it to be called. Lower median molecular coverage values result in less sensitive detection of variants at 0.1% frequency, although still sufficient for sensitive detection of variants with higher frequency. For example, Median Molecular Coverage of 700 is sufficient for accurate detection of variants at 0.5% frequency.
LOD %
A segment (e.g., 0.02−0.03) where 0.02 represents the median value across all targets, and 0.03 represents the limit of detection (LOD) for the 80th percentile targets. If both numbers are ≤0.1% then the sequencing run is of acceptable quality for 0.1% LOD.
For sensitive variant detection down to 0.1% frequency, we see optimal results when targeting a Median Read Coverage >25,000, Median Molecular Coverage >2,500, and both numbers of the LOD % segment are ≤0.1.
- In the Liquid Biopsy tab, view Mol Depth, Mol Counts, and other columns.
Note: When you open a visualization that includes REFERENCE calls for hotspot alleles, and consecutive REFERENCE calls are present, some records might have empty values in the Mol Counts, Mol Freq, and Detection Limits columns. This occurs when consecutive REF calls occur. The empty values are equivalent to values reported in the first record of the group of consecutive REF calls that are found in the genome, and shown in the BED file, or as sorted by the software in consecutive rows of the Analysis Results table.
Column
Description
Molecular Depth
Reports number of interrogated DNA molecules containing target. It defines limit of detection at hotspot position in a particular run and sample. For instance, if molecular depth is ≥1,500, you can have high confidence that no variant is present at 0.2%. If molecular depth is ≥2,500, you can have high confidence that no variant is present down to 0.1% LOD.
For reference calls, Molecular Depth provides measurable metric that serves as confirmation for variant absence among a large number of interrogated molecules.
Molecular Counts
Reports the number of detected DNA molecules containing variant allele.
- In the Oncomine tab, click the column headings to sort the list of variants by Oncomine Variant Class and Oncomine Gene Class.
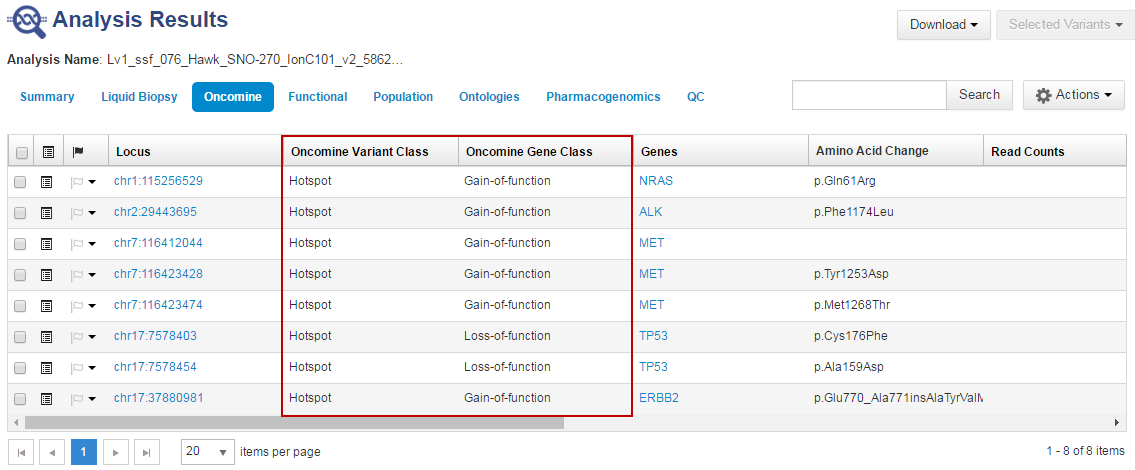
Reference calls display chromosomal position with empty value in the Amino Acid Change column.
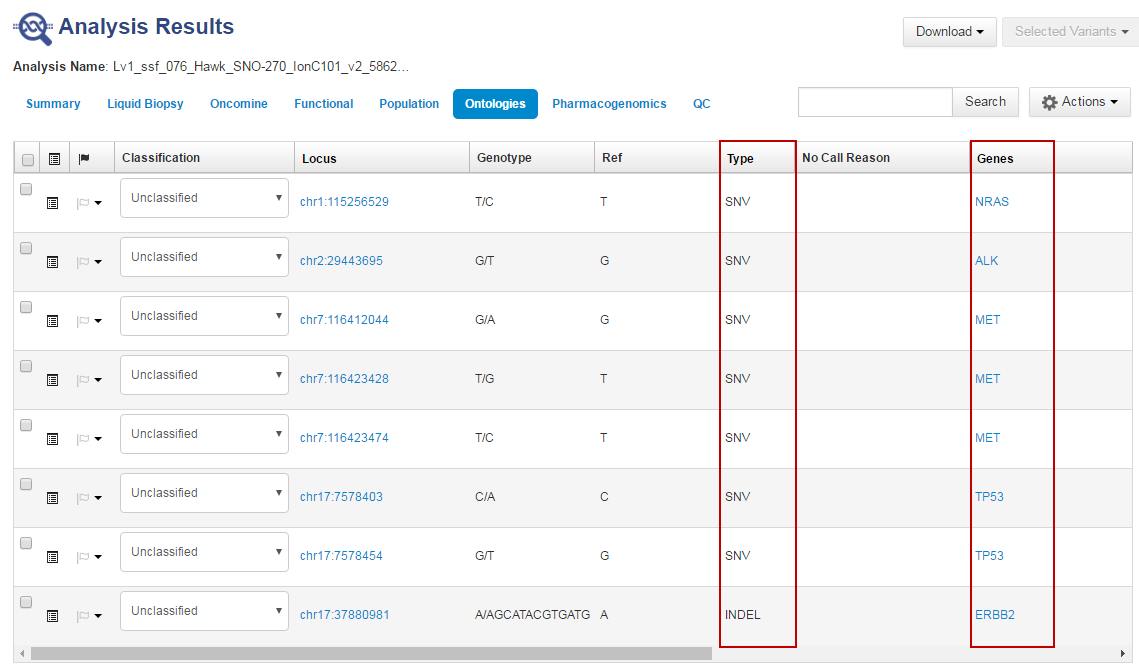
- In the Ontologies tab, click the column headings to sort the list by variant Type or Genes to analyze your results.