Visualize OTU results with R-scripts graphs
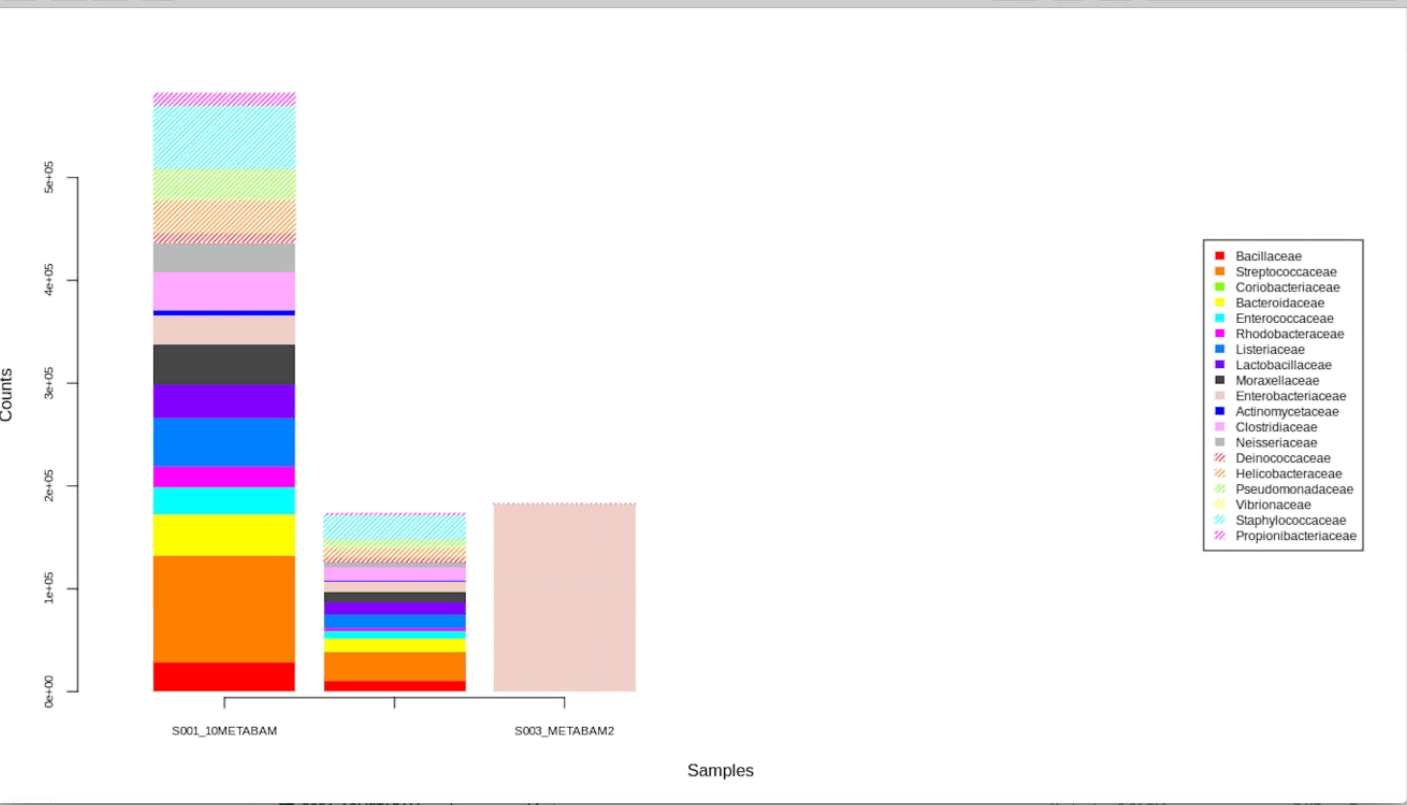
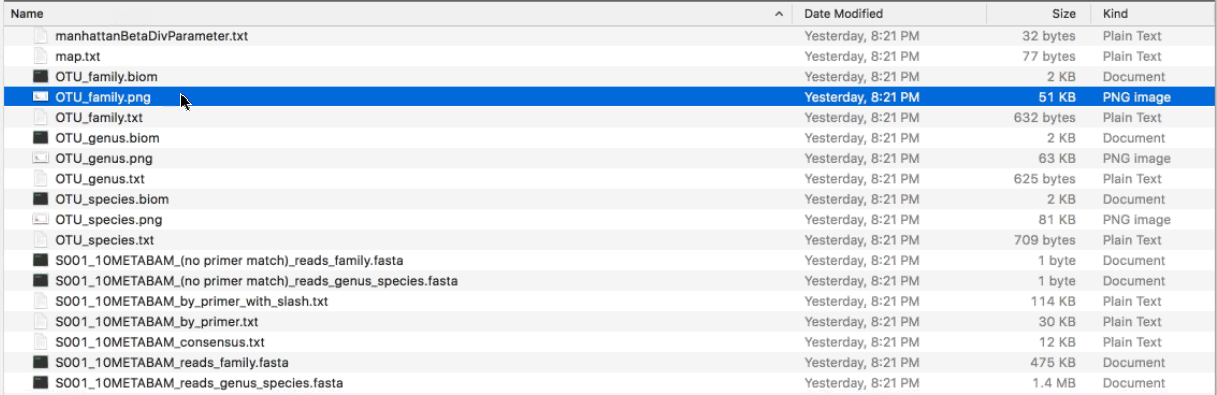
In Ion Reporter™ Software, OTU files are displayed graphically. For instance, in the example below, the OTU_family.txt file is rendered graphically in the OTU_family.png file.
- Download your results.
-
Click the PNG file of the results.
The data is displayed visually.