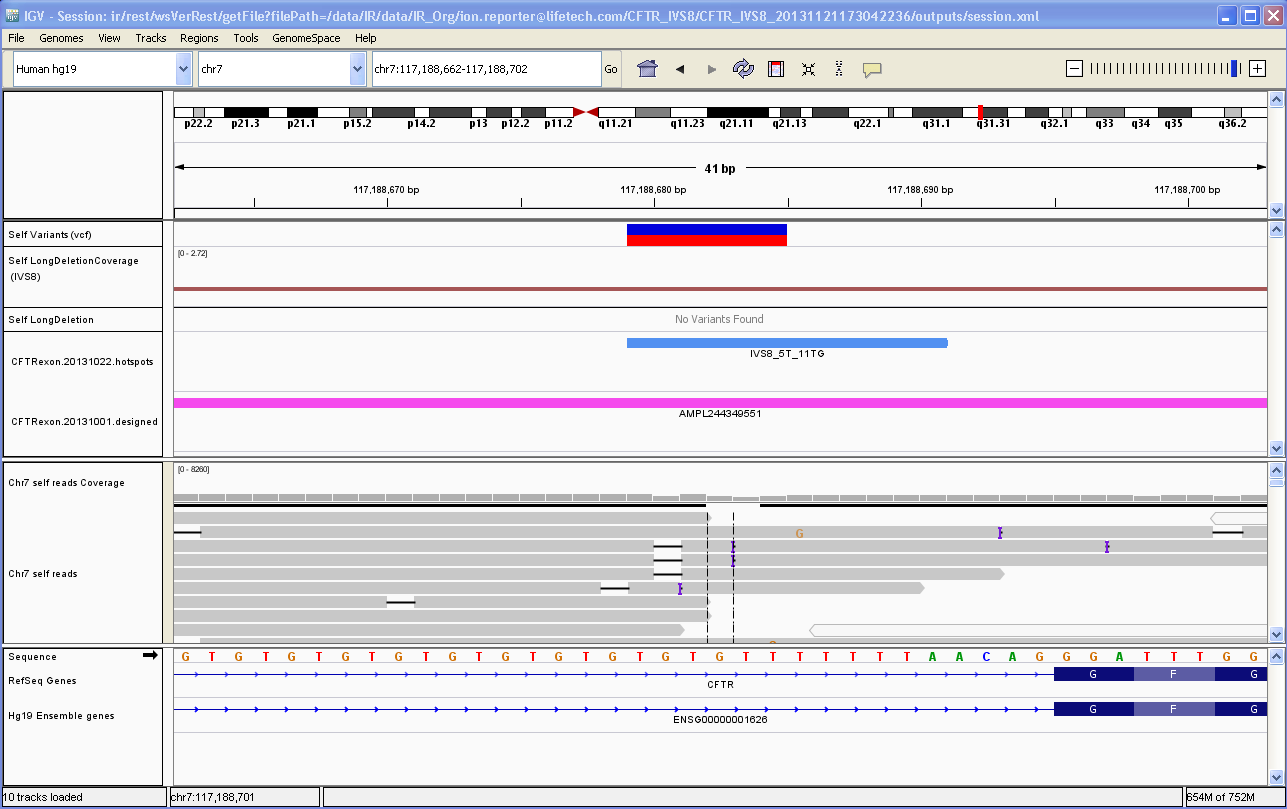
Visualize variants with IGV
You must have IGV set as the default viewer in Ion Reporter™ Software before you start this procedure. For more information, see Set IRGV or IGV as the default viewer.
You can visualize data from Ion Reporter™ Software with the Broad Institute Integrative Genomics Viewer (IGV). The viewer is available at the Broad Institute website: http://software.broadinstitute.org/software/igv/home.
If you visualize different analyses in IGV that use the same samples or the same panel files (but different algorithm versions, for example), the reads, read counts, BED file, and other tracks load into the browser only one time. In this case, if the software detects exact duplicate tracks, all unique tracks load separately if the software detects any differences in results data or input tracks between multiple analyses for visualizations of the requested analyses.
Note: In an IGV visualization, hotspots files that are in shown in a track in can include IGV annotations for hotspots that were not used to call bases in the data.
- In the Analysis tab, click the name for the analysis of interest to open analysis results.
-
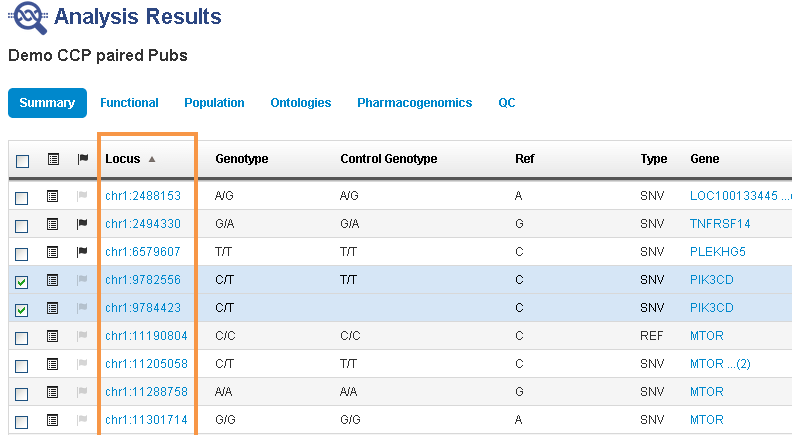
In the Analysis Results screen, click the locus for a variant of interest, and then complete the following steps.
 A ZIP file that contains files for upload to the Integrative Genomics Viewer (IGV).
- Open IGV on your computer.
- Unzip the files, then open the session.xml file in IGV.
The files that are exported contains only the following information for the selected variant.
-
For DNA variants
-
Sliced data are available for download that is based on the variant locus and flanking 200 base pairs.
-
Required files in the ZIP file includes all files, except for the reference genome FASTA files, which are not included.
-
-
For DNA CNV variants
-
Sliced data are available for download that is based on the CNV start position of - 200 and CNV end position of + 200 base pairs.
-
Required files in the ZIP file includes all files, except for the reference genome FASTA files, which are not included.
-
-
For RNA variants
-
Sliced data are available for download that is based on the fusion isoform.
-