Visualize an analysis workflow that contains a CNV baseline
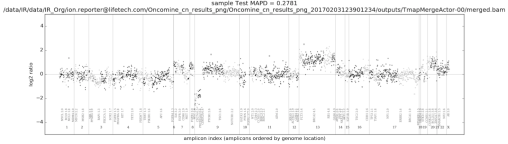
If you add a CNV baseline to an analysis workflow, you can you can download and view the analysis results in the cn_results.png. In this example, a Variability Correction Informatics Baseline (VCIB) baseline was used.
These example analysis results shows a plot with log2 ratios across the genome and highlights panel CNV IDs, in this case gene symbols, to help with reviews of calls made by the CNV detection algorithm. The alternating gray and black dot color is used to distinguish between adjacent amplicons in the CNV IDs. The outliers in the data are drawn as small circles. The X axis shows the chromosomes numbers. The CNV ID names and the mean copy number call for each CNV ID are indicated above the chromosomes at their approximate location. This example has copy number gains on chromosomes 13 and 20, and deletion of a portion of chromosome 9, and possibly other subchromosomal events. The MAPD value of 0.2781 for the sample is displayed at the top of the plot and is a QC metric measuring the noisiness of the sample. A low MAPD is good. MAPD at, or greater than, 0.5 is considered to fail QC. Log2 ratios of 0 are equivalent to a copy number call of 2 (normal for autosomes and female X). If the sample is for a male, you would expect to see the log ratio equivalent to a copy number of 1 on chromosome X.