
Compare results of single or multiple analyses
You can review results for single analyses, or compare the results of multiple analyses in the Analysis Visualization screen. Visualization for multiple analyses supports the following views, depending on analysis workflow type.
-
In the Variants Table tab, the table view shows side-by-side columns to compare variant calls in different analyses:
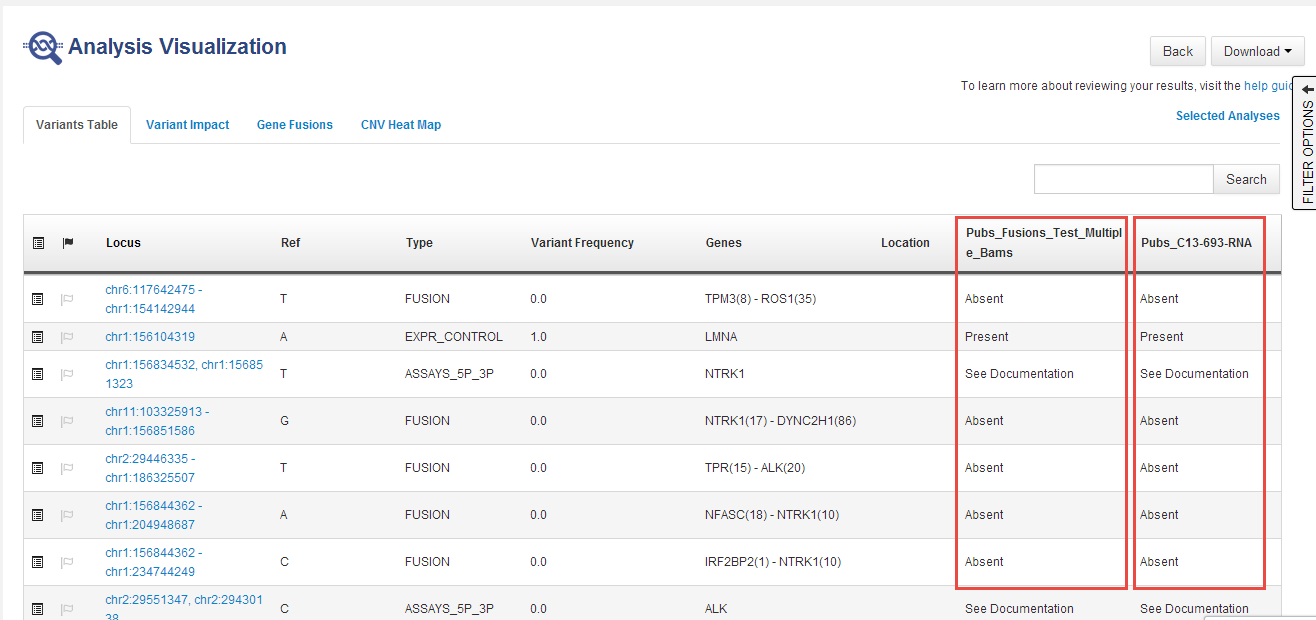
-
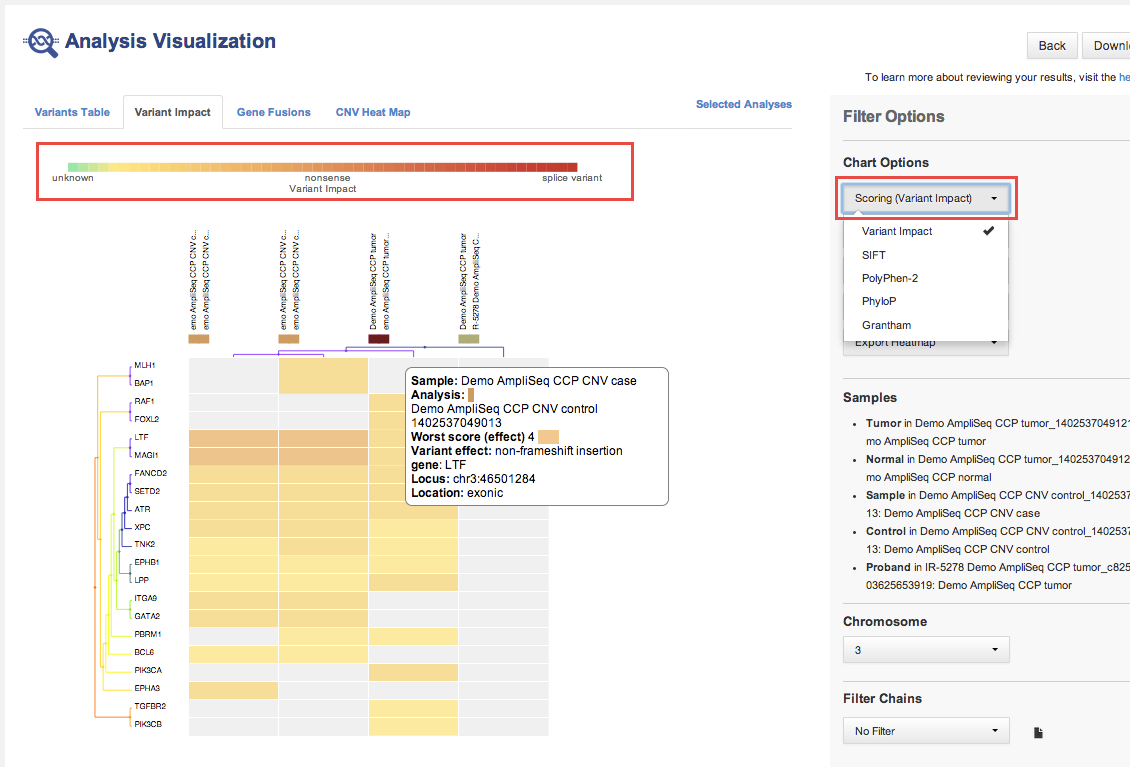
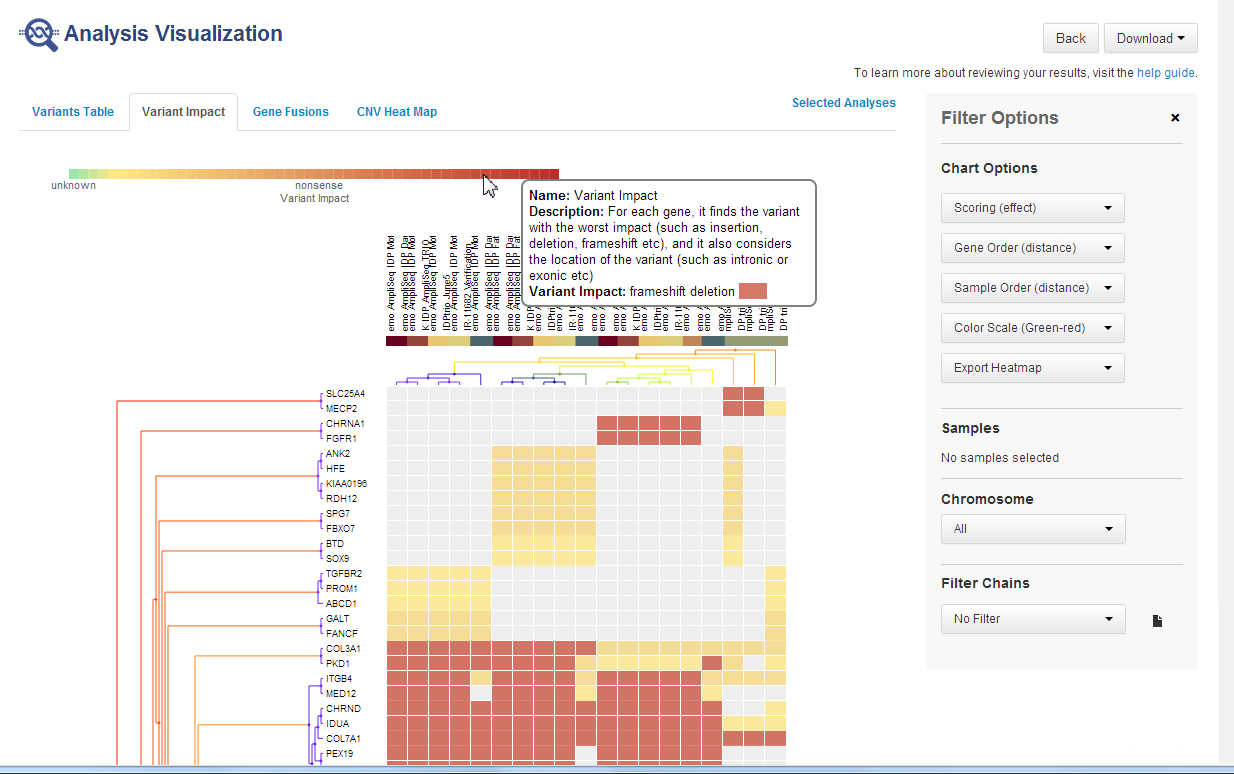
In the Variant Impact tab, the variant impact heat map that displays is based on the predicted variant impact:
The following is a variant impact heat map that is based on the predicted variant impact.
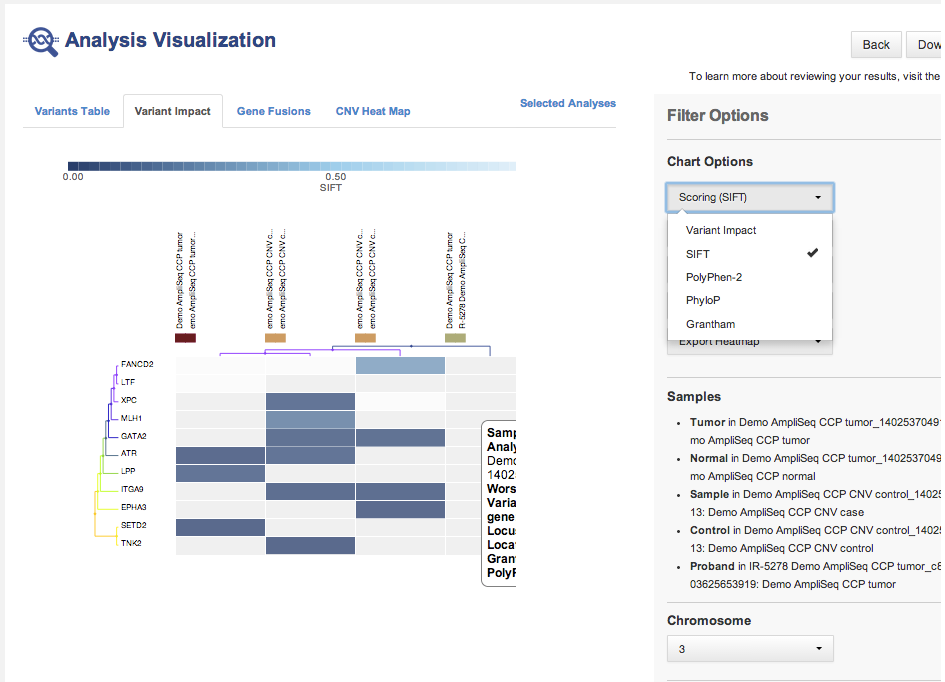
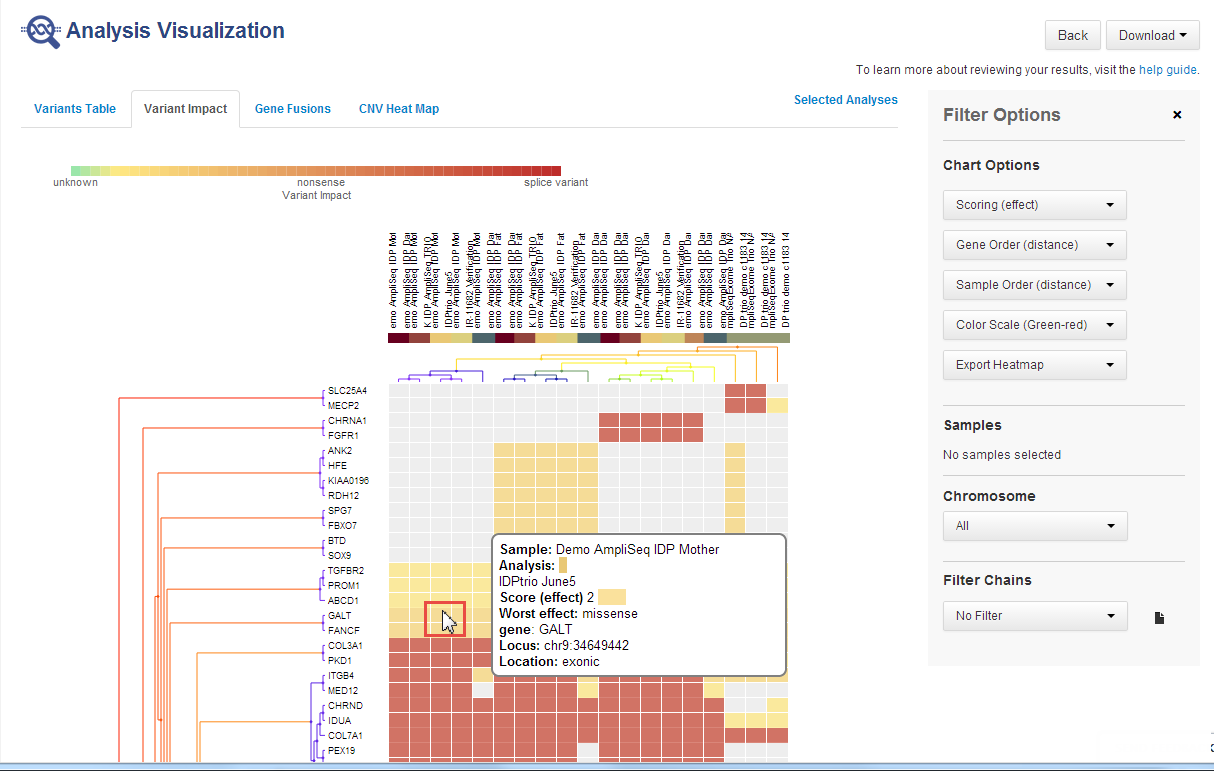
The following is a variant impact heat map that is based on other scoring.
The following is a gene fusions heat map.

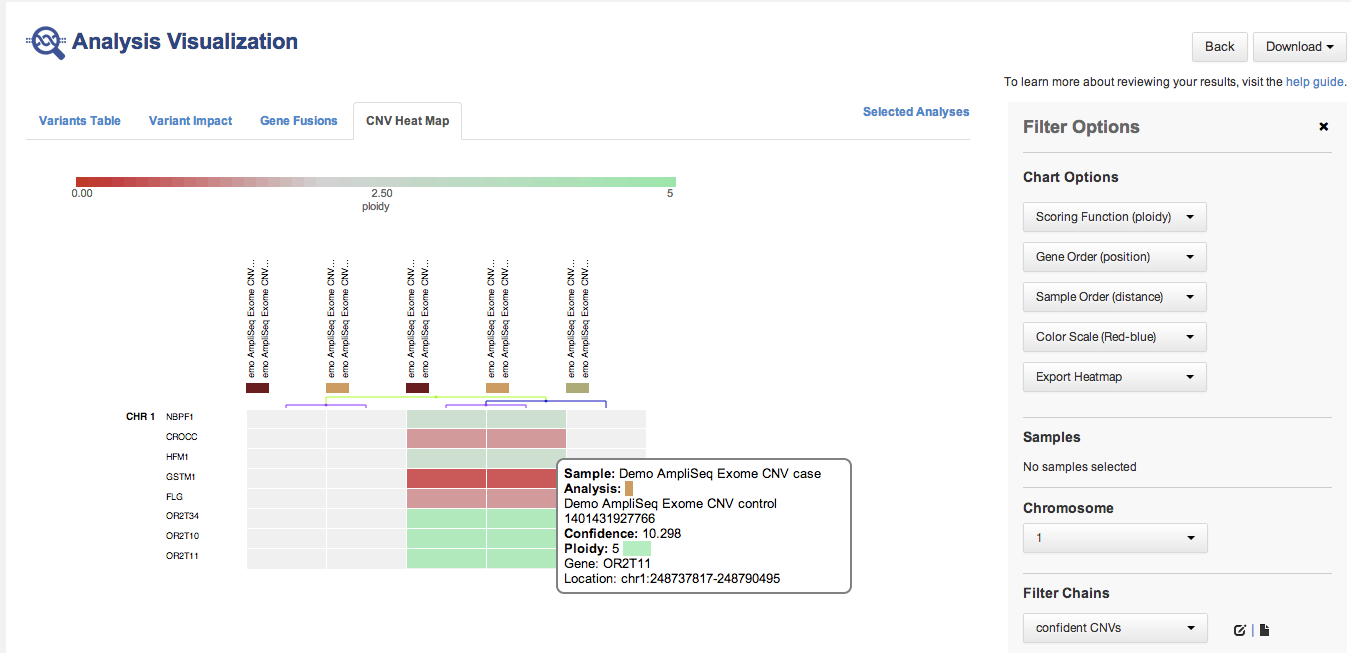
The following is a CNV heat map.
-
RNA Exon Variants:

-
In most cases, similar analyses are compared. However, Ion Reporter™ Software does not restrict comparisons to only similar analyses.
-
You can compare one trio or one paired analysis without selecting multiple analyses. Each trio or paired analysis contains more than one set of variants.
-
Place the pointer over the legend of a heat map:
Hover over the legend of a cell to see more information:
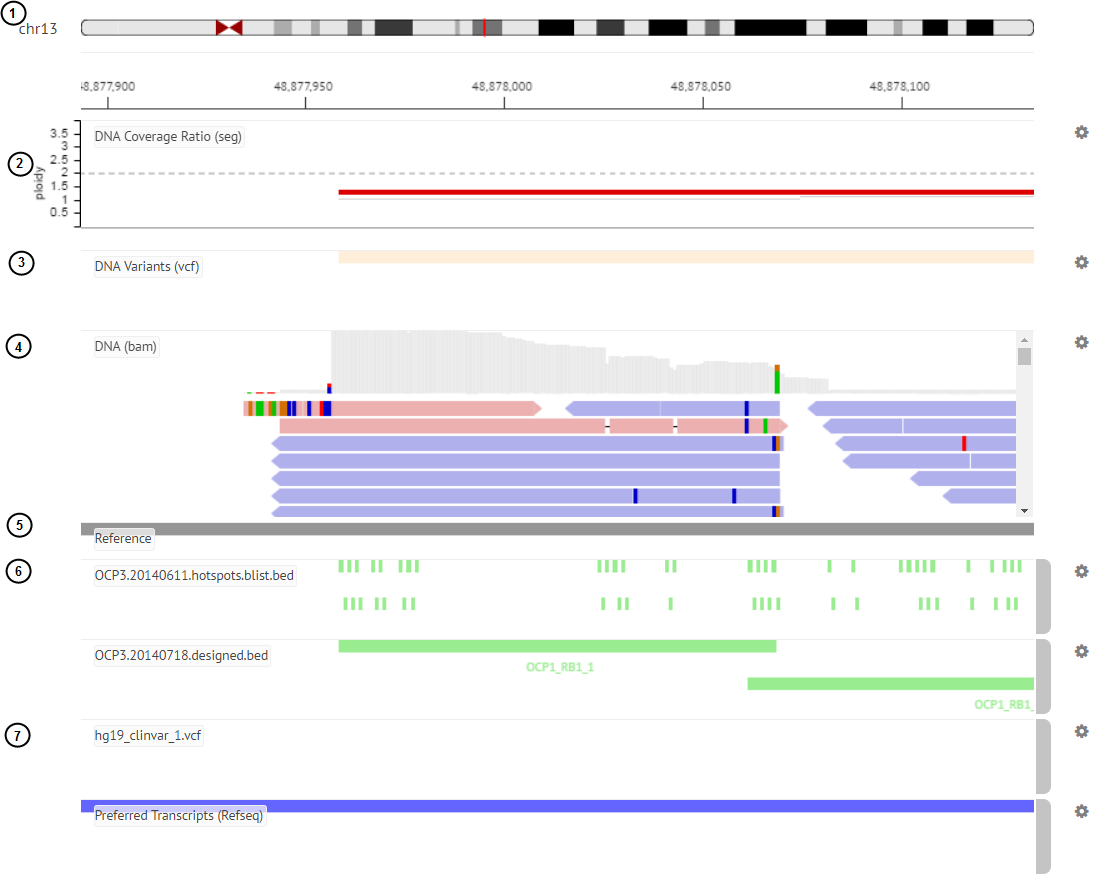
Track order for non-aneuploidy analyses
Note: In the GRCh38 genome reference, there exists alternate contigs. Ion Reporter™ Software includes the contig that contains the GSTT1 gene and reports on amplifications or deletions at the GSTT1 gene if they occur.
After the Whole Genome View of each non-aneuploidy analysis, the various data tracks are loaded in this order by default:
-
Selected chromosome ideogram
-
Copy Number segment (.seg) file
-
VCF file
-
BAM track for each sample.
Note: A maximum of 500 aligned reads are shown in each BAM track in Ion Reporter™ Genomic Viewer (IRGV). To see more than 500 aligned reads, use Integrative Genomics Viewer (IGV). -
Genome reference track
-
Design BED files and hotspot files
-
Annotation tracks (COSMIC, ClinVar, and preferred transcript annotation tracks)