
Variant Impact tab
The Variant Impact tab provides visual representation of the impact that the detected variants have on the sequence of the affected genes and transcripts, as well as the sequence, structure, and function of the affected proteins. The data is presented in the form of a heat map.
Use the menus in the Filter Options pane to limit the data that is displayed in the heat map.
-
For more information on the Samples Venn diagram, see Samples Venn diagram in Filter Options.
-
For more information on using the Chromosome filter, see Chromosome filter in the Filter Options.
-
For more information on using the Filter Chains filter, see Filter Chains filter in the Filter Options.
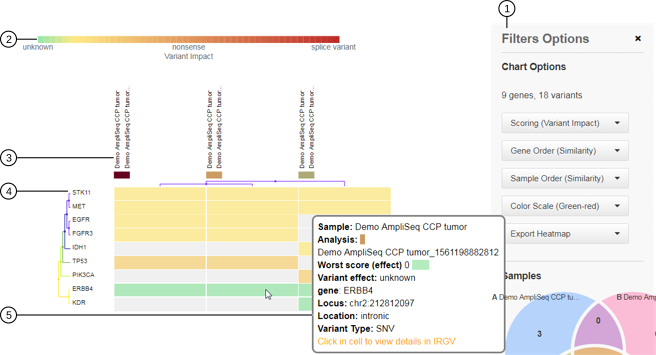
-
Heat map Filter Options.
-
Heat map legend. The legend changes, depending on the scoring that is option that is selected in the Chart Options.
-
Samples and analyses: hover over sample and analysis names to view the sample and analysis details.
-
Genes: hover over a gene ID to view the sum of scores for that gene or click on a gene ID to view the details for all analyses in IRGV.
-
Variants: hover over a variant to view the details pane for that variant, or click in the cell to view the details for that variant in IRGV.
Use the following Chart Options to display the heat maps of choice and customize the heat map view.
|
Chart Option |
Description |
|---|---|
|
Scoring – The heat map for each option are color coded based on the selected scoring option. |
|
|
Variant Impact |
For each gene, the variant impact is scored based on the severity of the impact of the variant. The heat map is color coded using the following impact score values, where higher values are associated with mutations that have more significant, or worse, impact.
|
|
SIFT |
A SIFT score predicts whether an amino acid substitution affects protein function. The SIFT score ranges from 0 to 1, where the score of 0 represents the most deleterious amino acid substitution and the score of 1 represents the most tolerated amino acid substitution. |
|
PolyPhen‑2 |
The PolyPhen‑2 score predicts the possible impact of an amino acid substitution on the structure and function of a human protein. The score represents the probability that a substitution is damaging. The reported score range is 0–2, with the following classifications for the impact of an amino acid substitution.
|
|
PhyloP |
The PhyloP score measures the evolutionary conservation at individual alignment sites. Positive scores measure conservation, or slower than expected evolution, and represent sites that are predicted to be conserved. Negative scores measure acceleration, or faster than expected evolution, and represent sites that are predicted to be fast-evolving. |
|
Grantham |
The Grantham score provides a prediction for the evolutionary distance between the amino acids. A lower score predicts a smaller evolutionary distance. A higher score predicts a greater evolutionary distance. |
|
Order – Organize the displayed results based on gene or sample order. |
|
|
Gene Order |
Select one of following options from the Gene Order dropdown list to arrange the order in which the genes are listed in the heat map.
|
|
Sample Order |
Select one of following options from the Sample Order dropdown list to arrange the order in which the genes are listed in the heat map.
|
|
Other |
|
|
Color Scale |
Select a color scale to customize the colors that are displayed in the heat map. |
|
Export Heatmap |
You can export and save your heat map in PNG, SVG, and CSV file formats. The file is automatically downloaded once you make your selection from the Export Heatmap dropdown list. |